Crew’s Cup
Case Discussion
A capstone case on quantitative customer research.
Presented to:
MKT 512
April 28, 2026
MKT 512
April 28, 2026

Theory
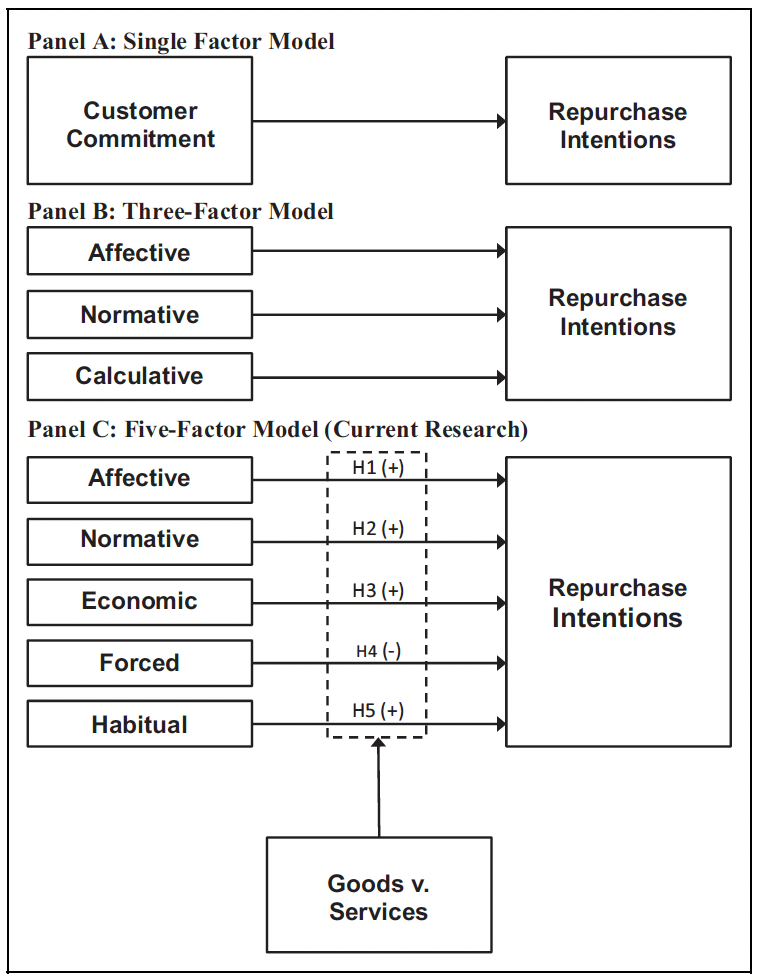
Published Evidence
Factor structure
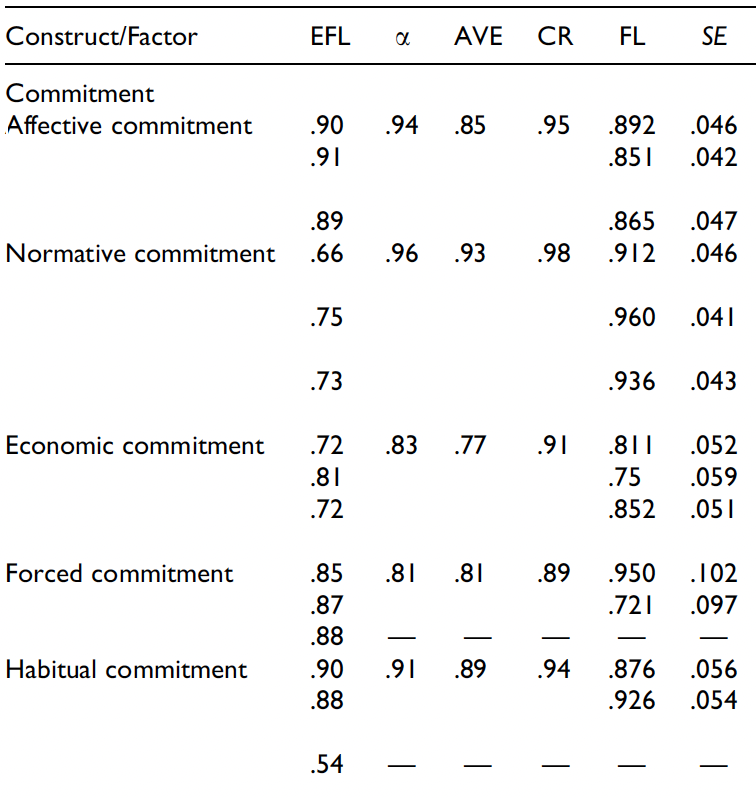
Factor structure
| Exploratory factor analysis | ||||||
| variable | uniqueness | fl1 | fl2 | fl3 | fl4 | fl5 |
|---|---|---|---|---|---|---|
| a1 | 0.277 | 0.074 | 0.037 | 0.846 | −0.010 | −0.035 |
| a2 | 0.067 | 0.004 | −0.087 | 0.960 | −0.058 | −0.016 |
| a3 | 0.266 | 0.070 | −0.019 | 0.852 | −0.024 | −0.055 |
| n1 | 0.365 | −0.142 | −0.146 | −0.044 | −0.018 | 0.769 |
| n2 | 0.057 | −0.061 | −0.120 | −0.012 | −0.038 | 0.961 |
| n3 | 0.378 | −0.120 | −0.180 | −0.053 | −0.053 | 0.755 |
| e1 | 0.240 | 0.128 | 0.833 | −0.039 | 0.143 | −0.166 |
| e2 | 0.078 | 0.134 | 0.928 | −0.007 | 0.097 | −0.181 |
| e3 | 0.268 | 0.161 | 0.824 | −0.019 | 0.083 | −0.143 |
| f1 | 0.203 | 0.877 | 0.122 | 0.045 | 0.019 | −0.103 |
| f2 | 0.045 | 0.963 | 0.090 | 0.078 | −0.003 | −0.117 |
| f3 | 0.173 | 0.871 | 0.214 | 0.047 | 0.043 | −0.134 |
| h1 | 0.246 | 0.039 | 0.255 | −0.072 | 0.821 | −0.091 |
| h2 | 0.211 | 0.045 | −0.015 | 0.029 | 0.886 | −0.018 |
| h3 | 0.214 | −0.025 | 0.094 | −0.055 | 0.879 | −0.010 |
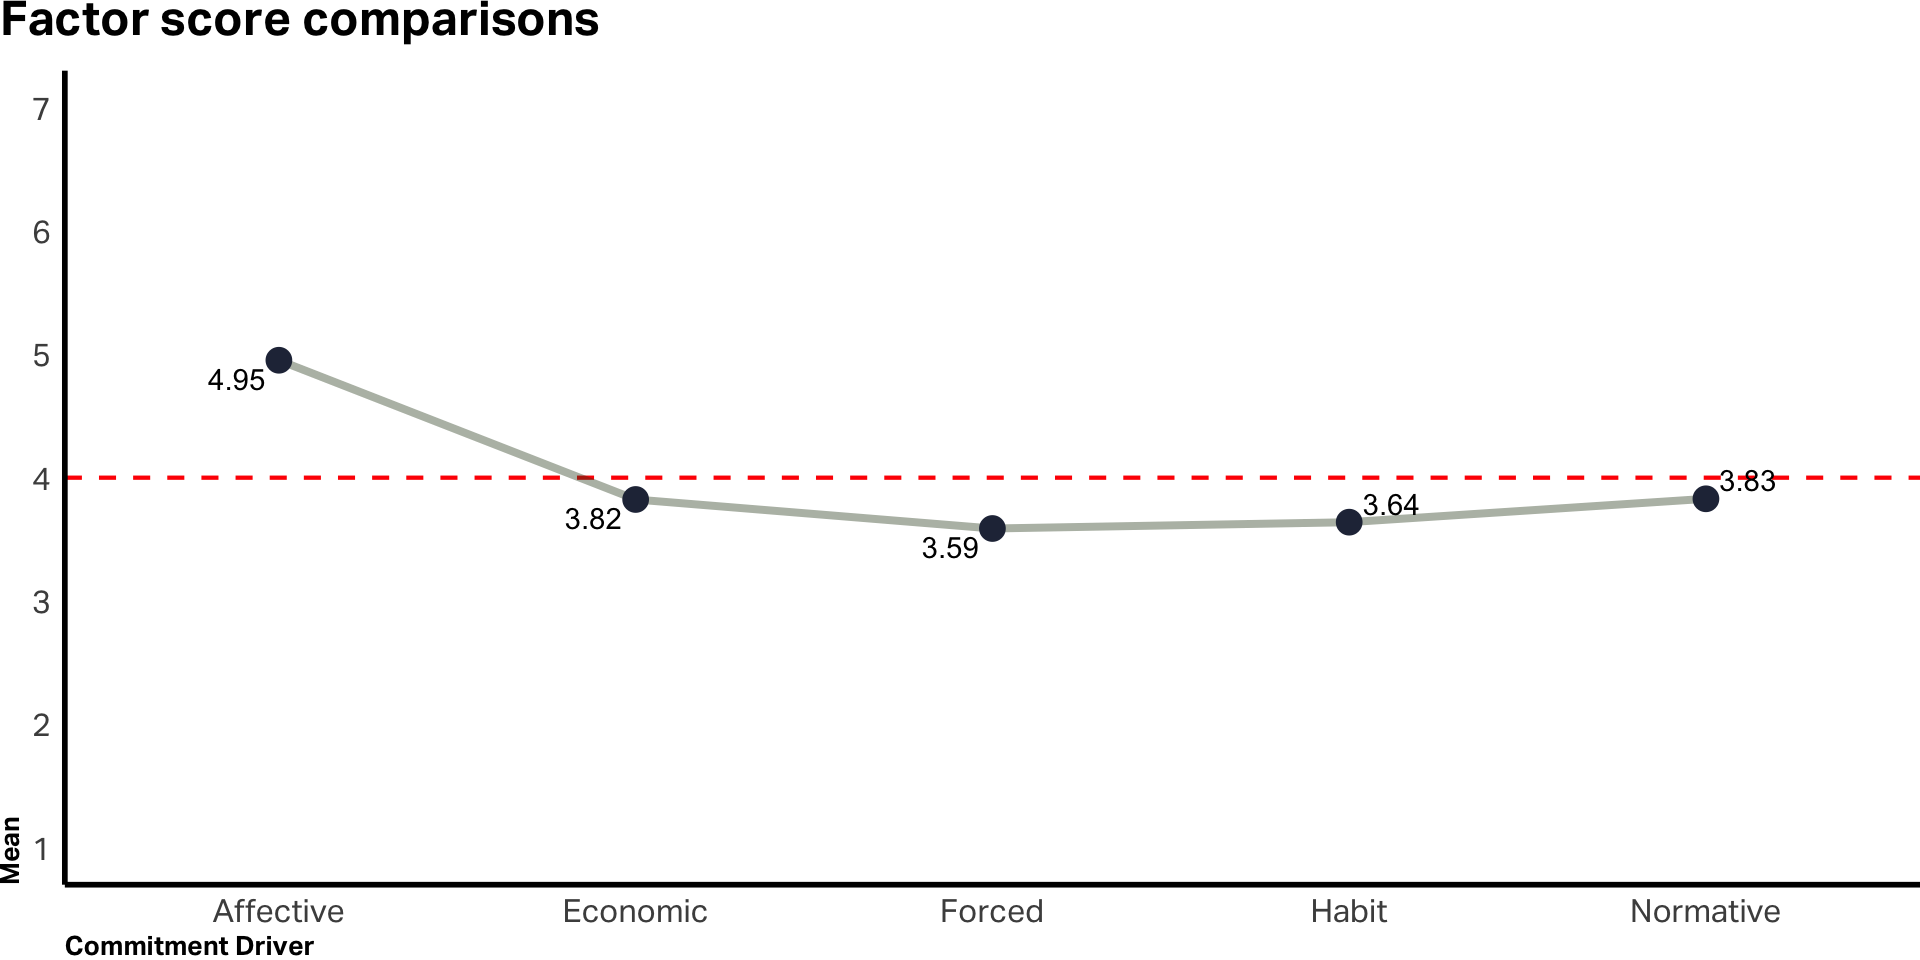
Commitment Drivers Overall
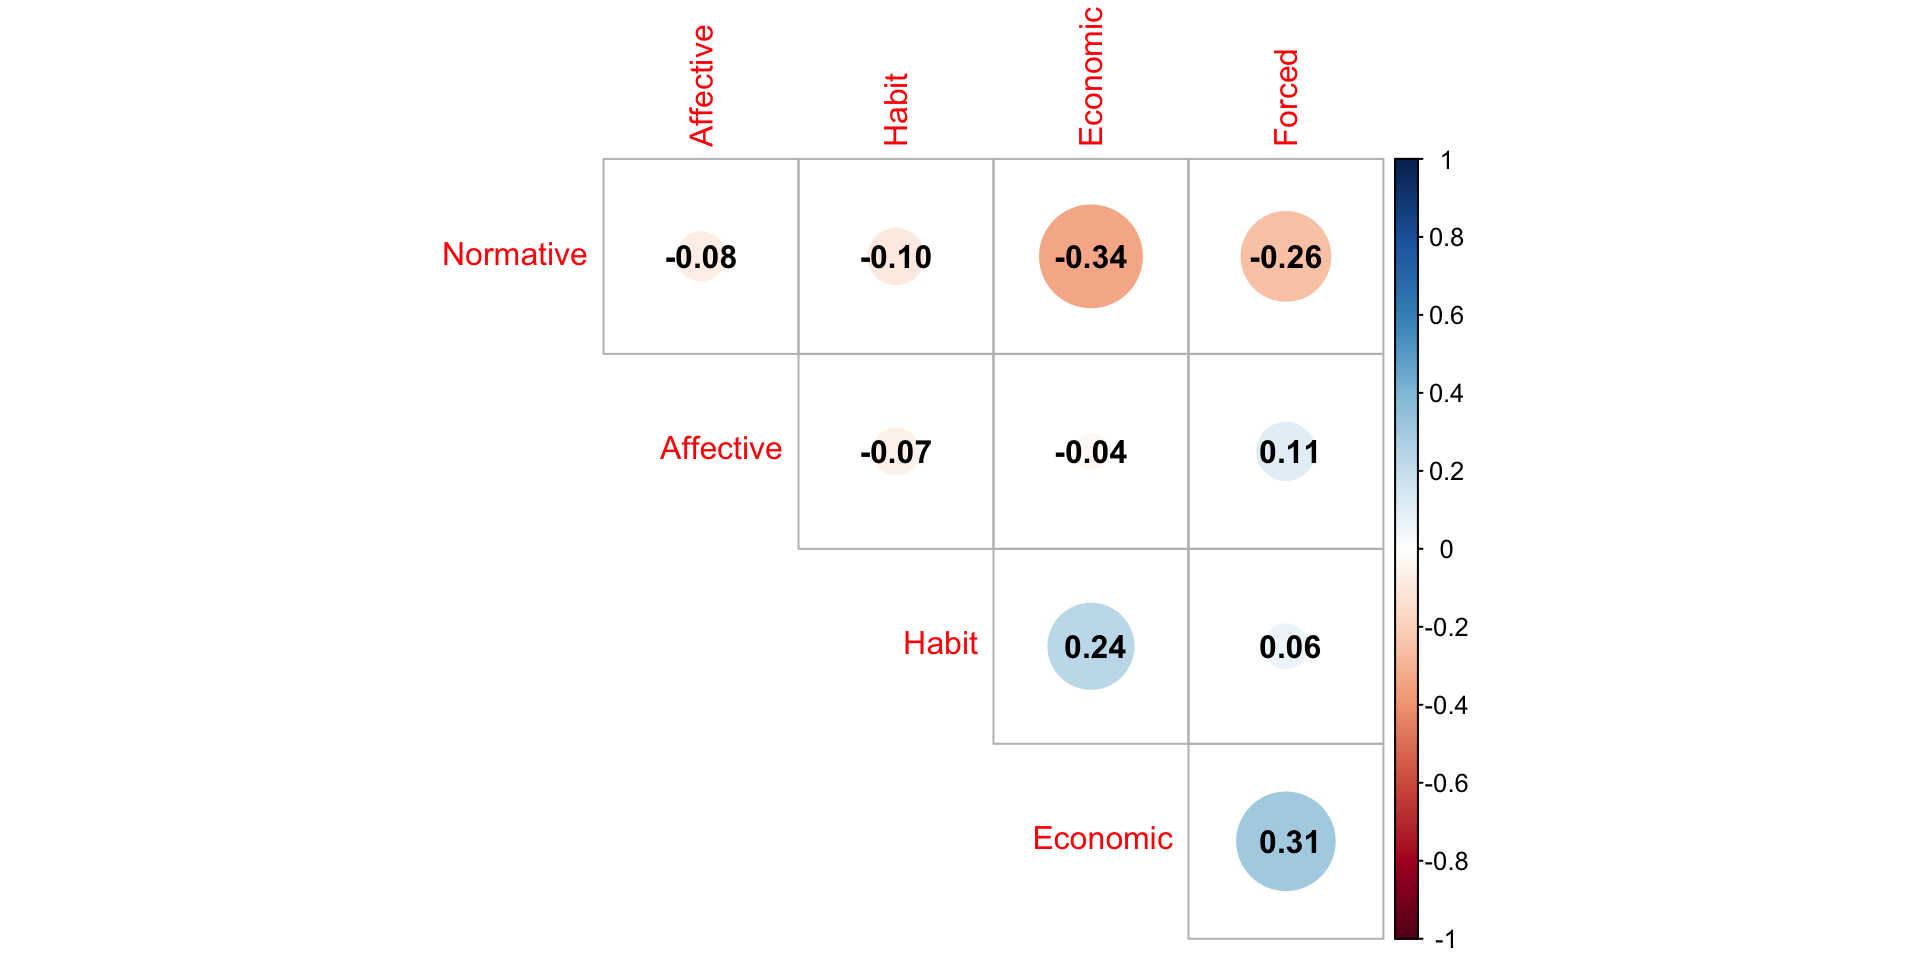
Commitment Correlations
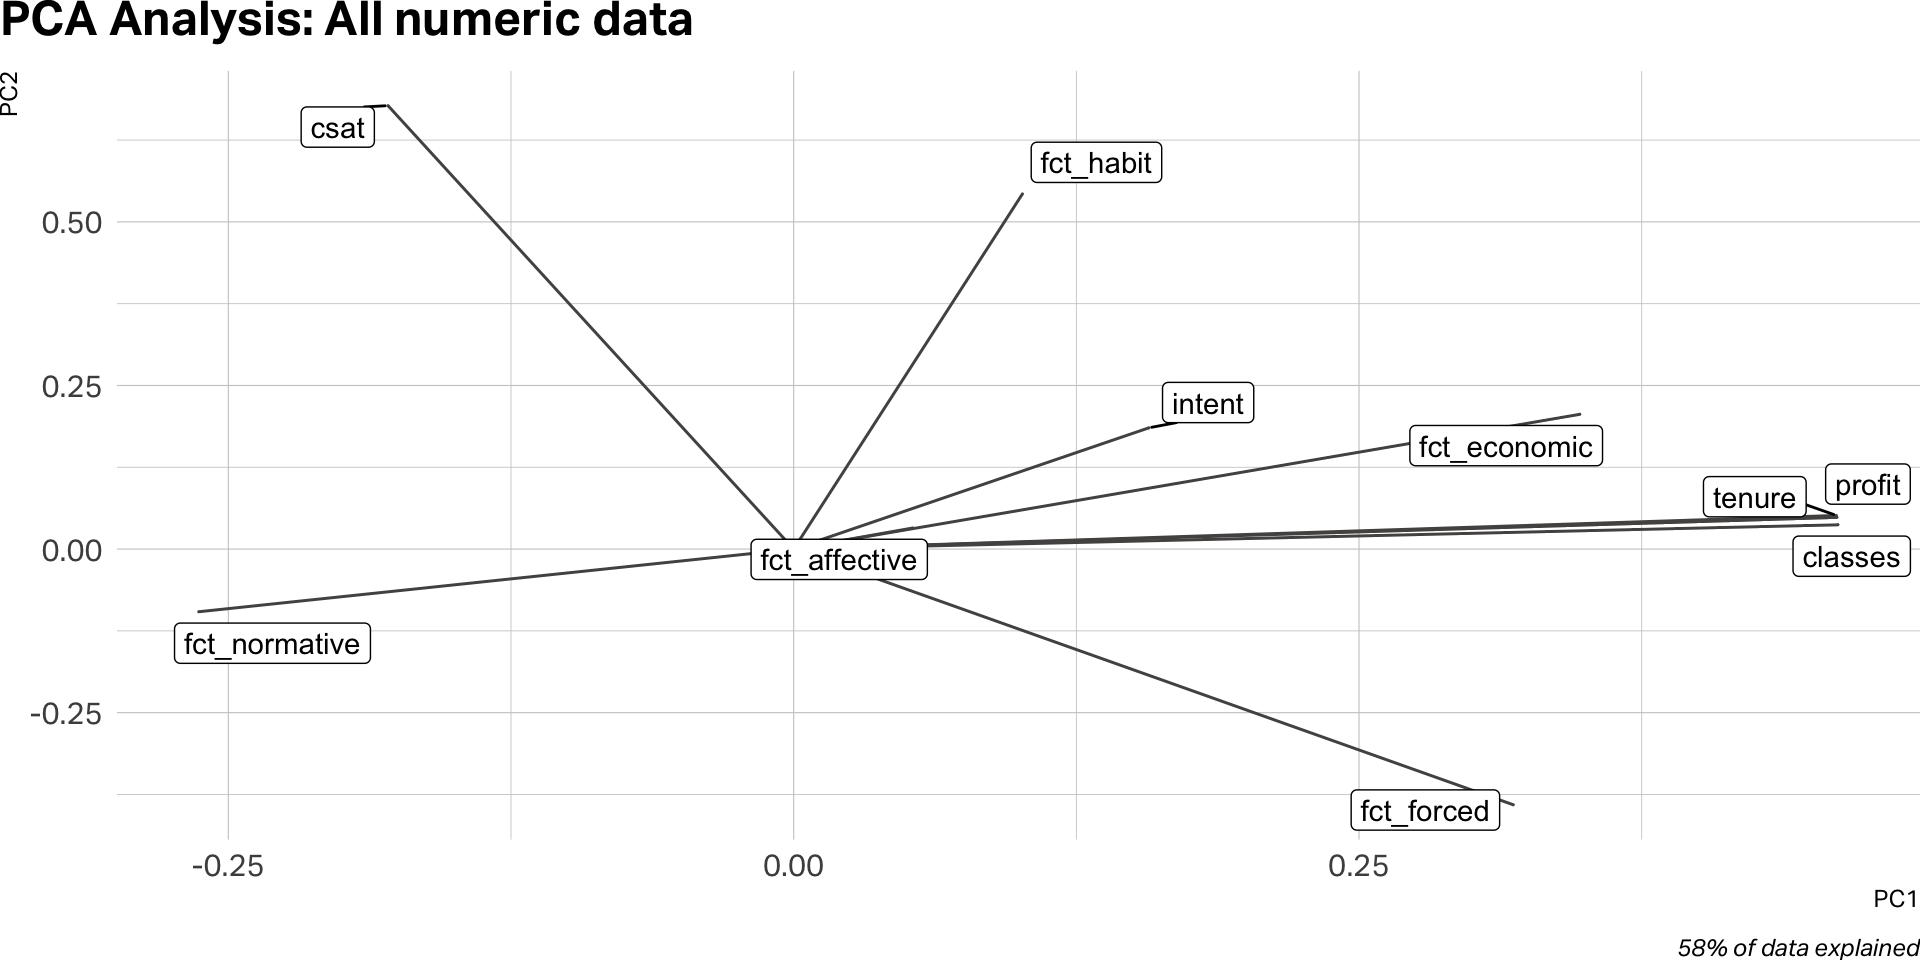
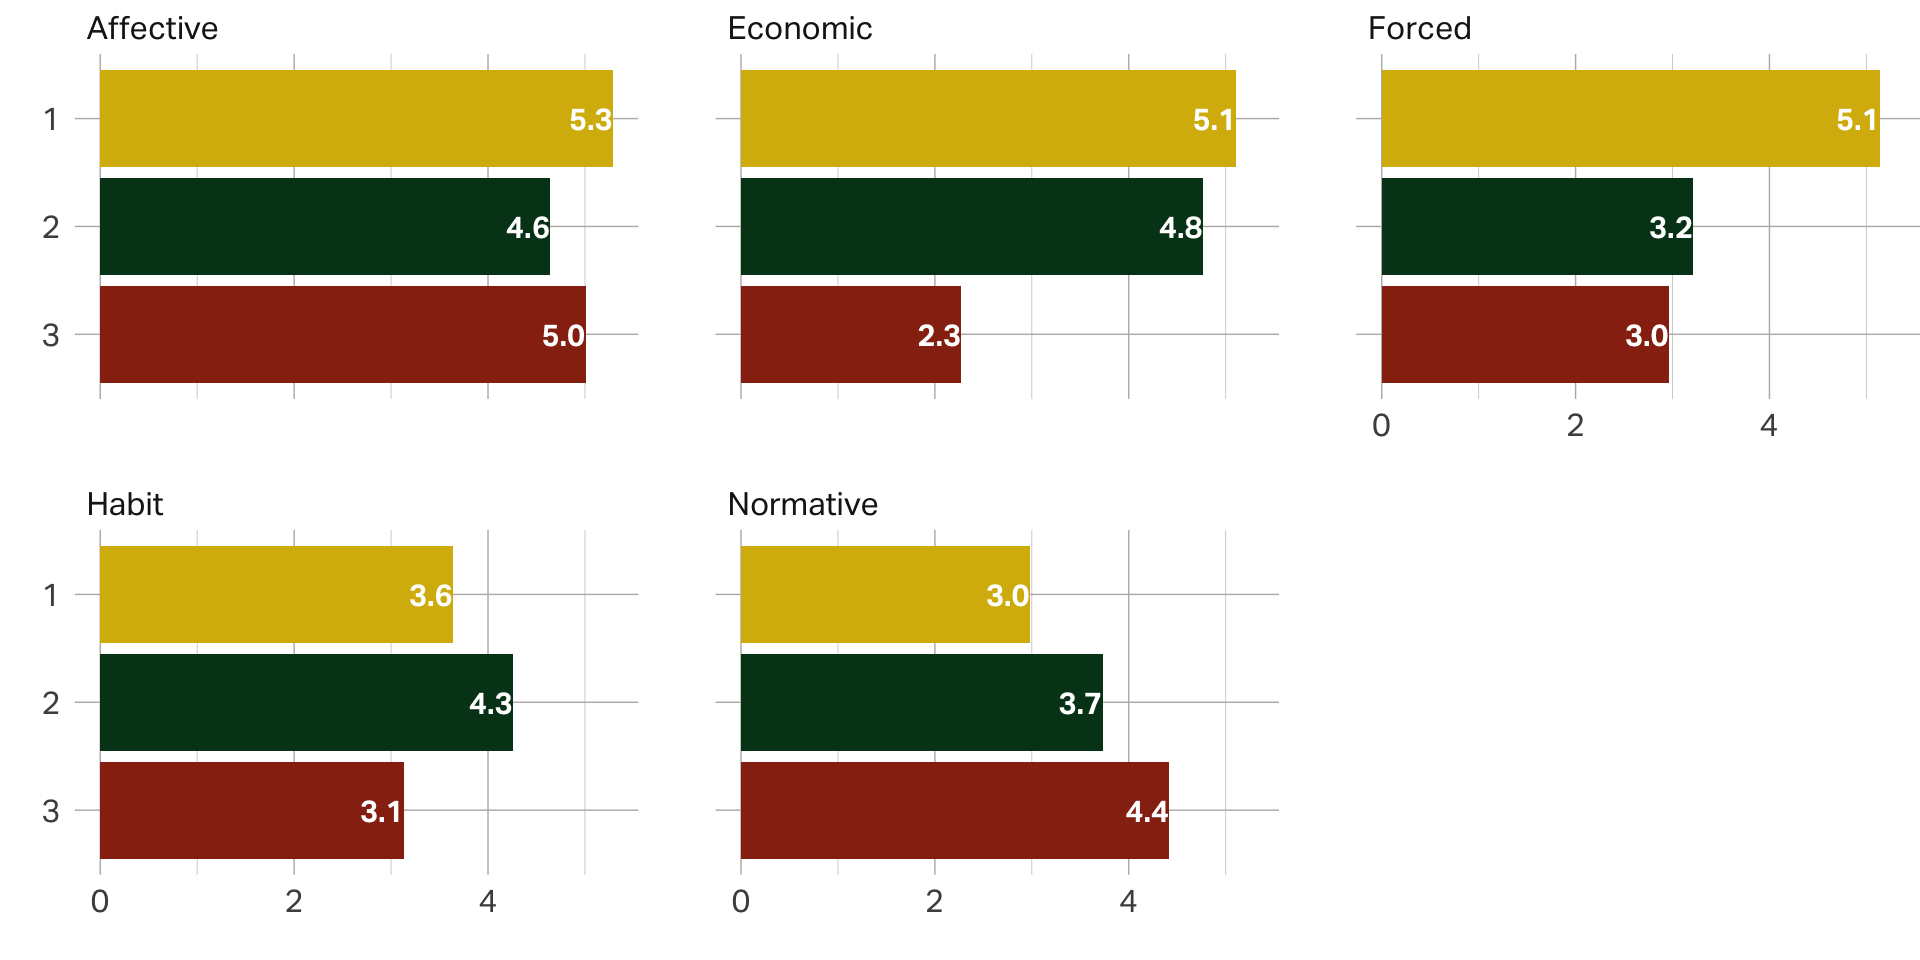
Segmentation
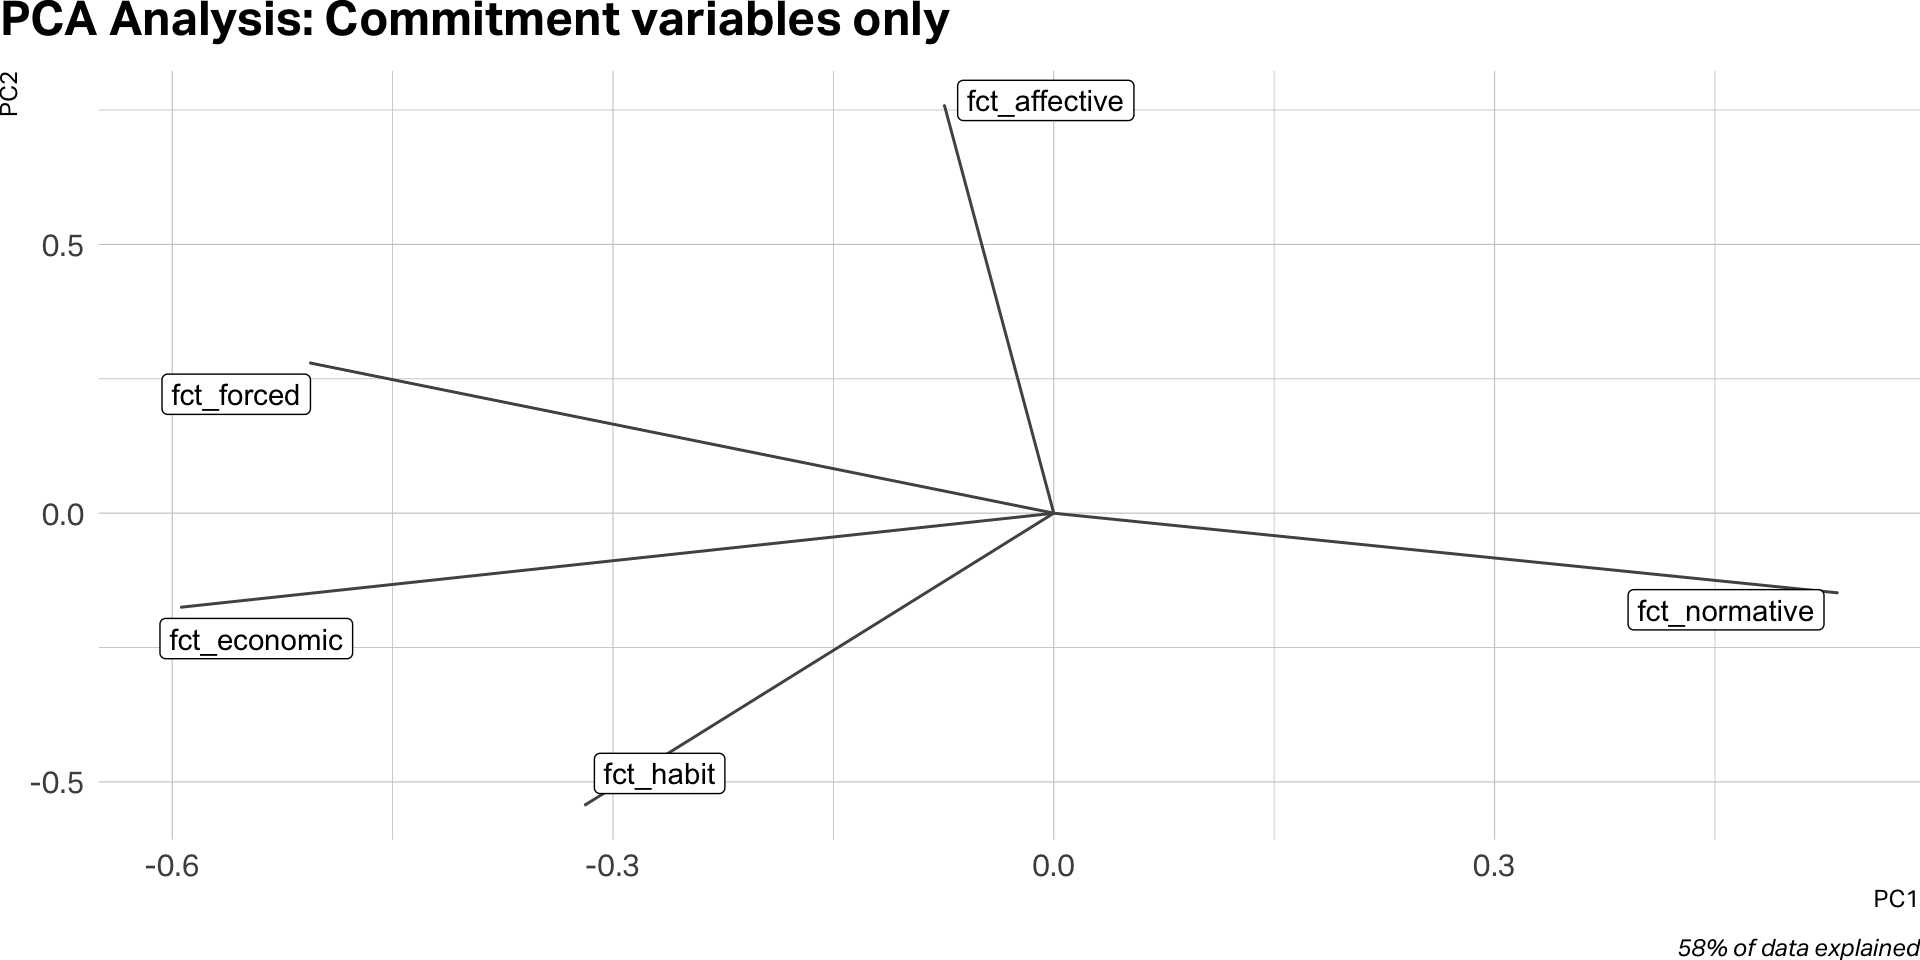
Committment variables only
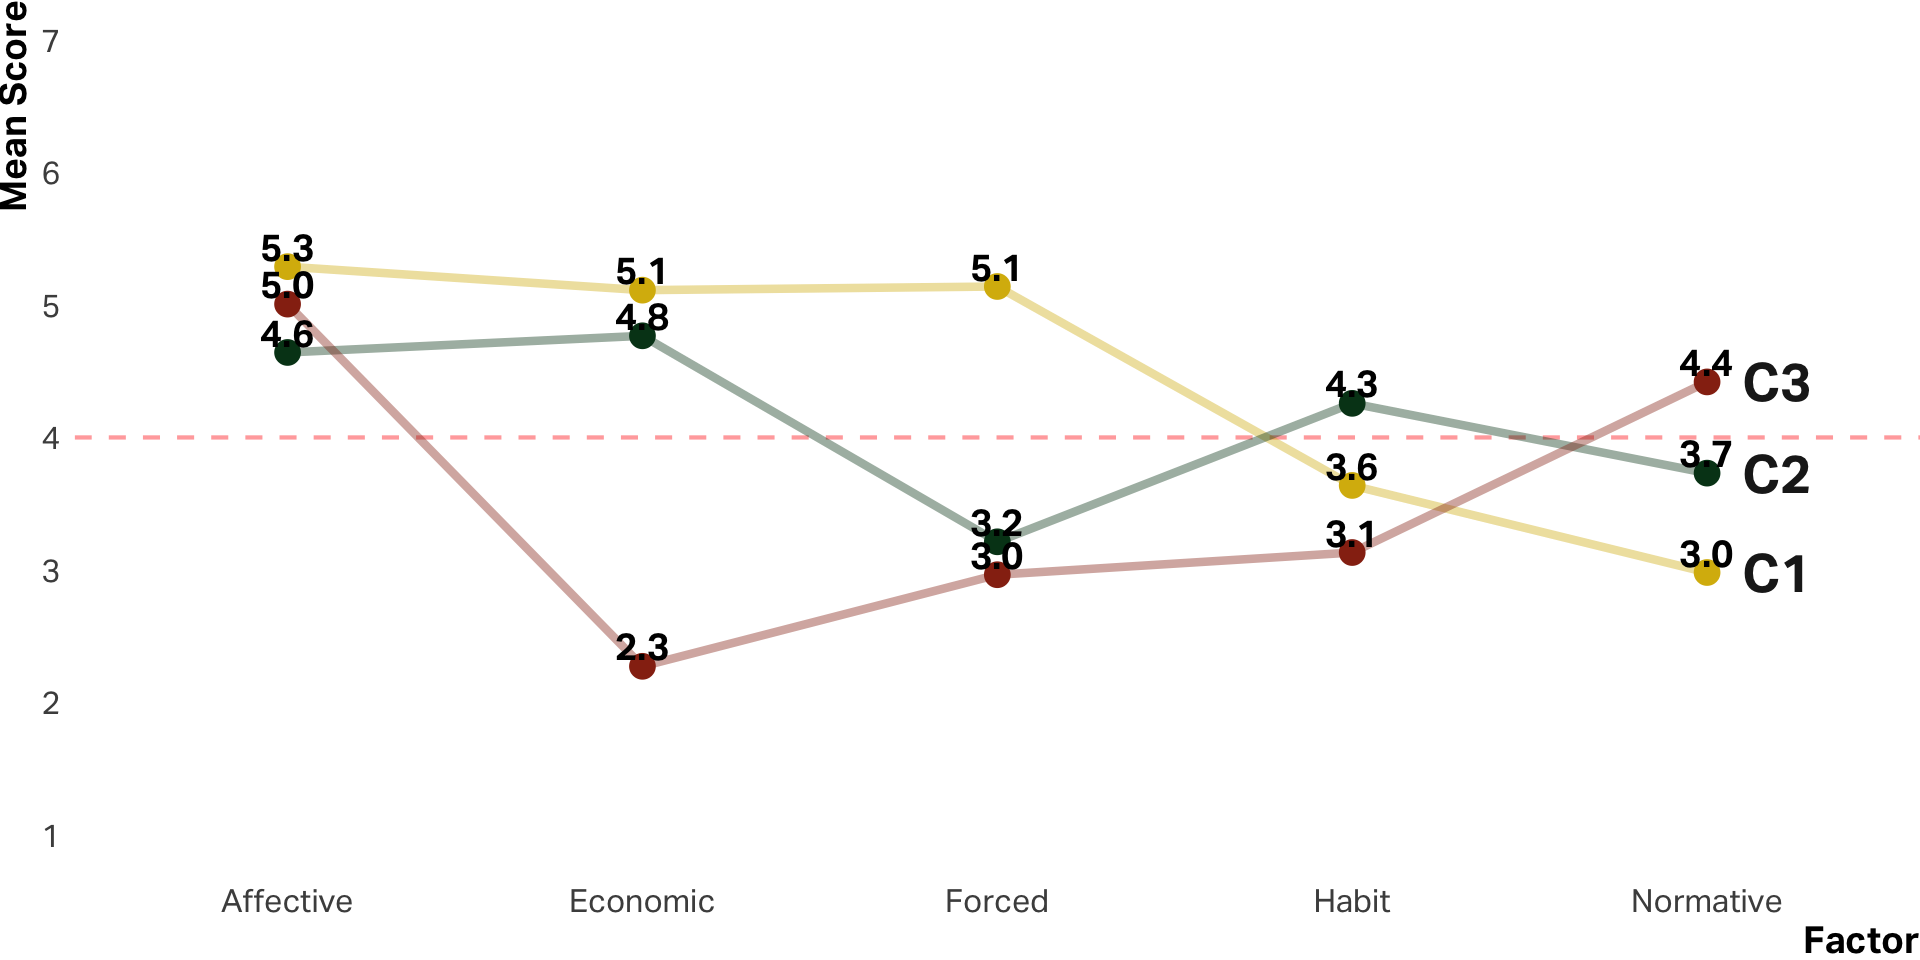
Characteristics by cluster
Another view
Cult initiation
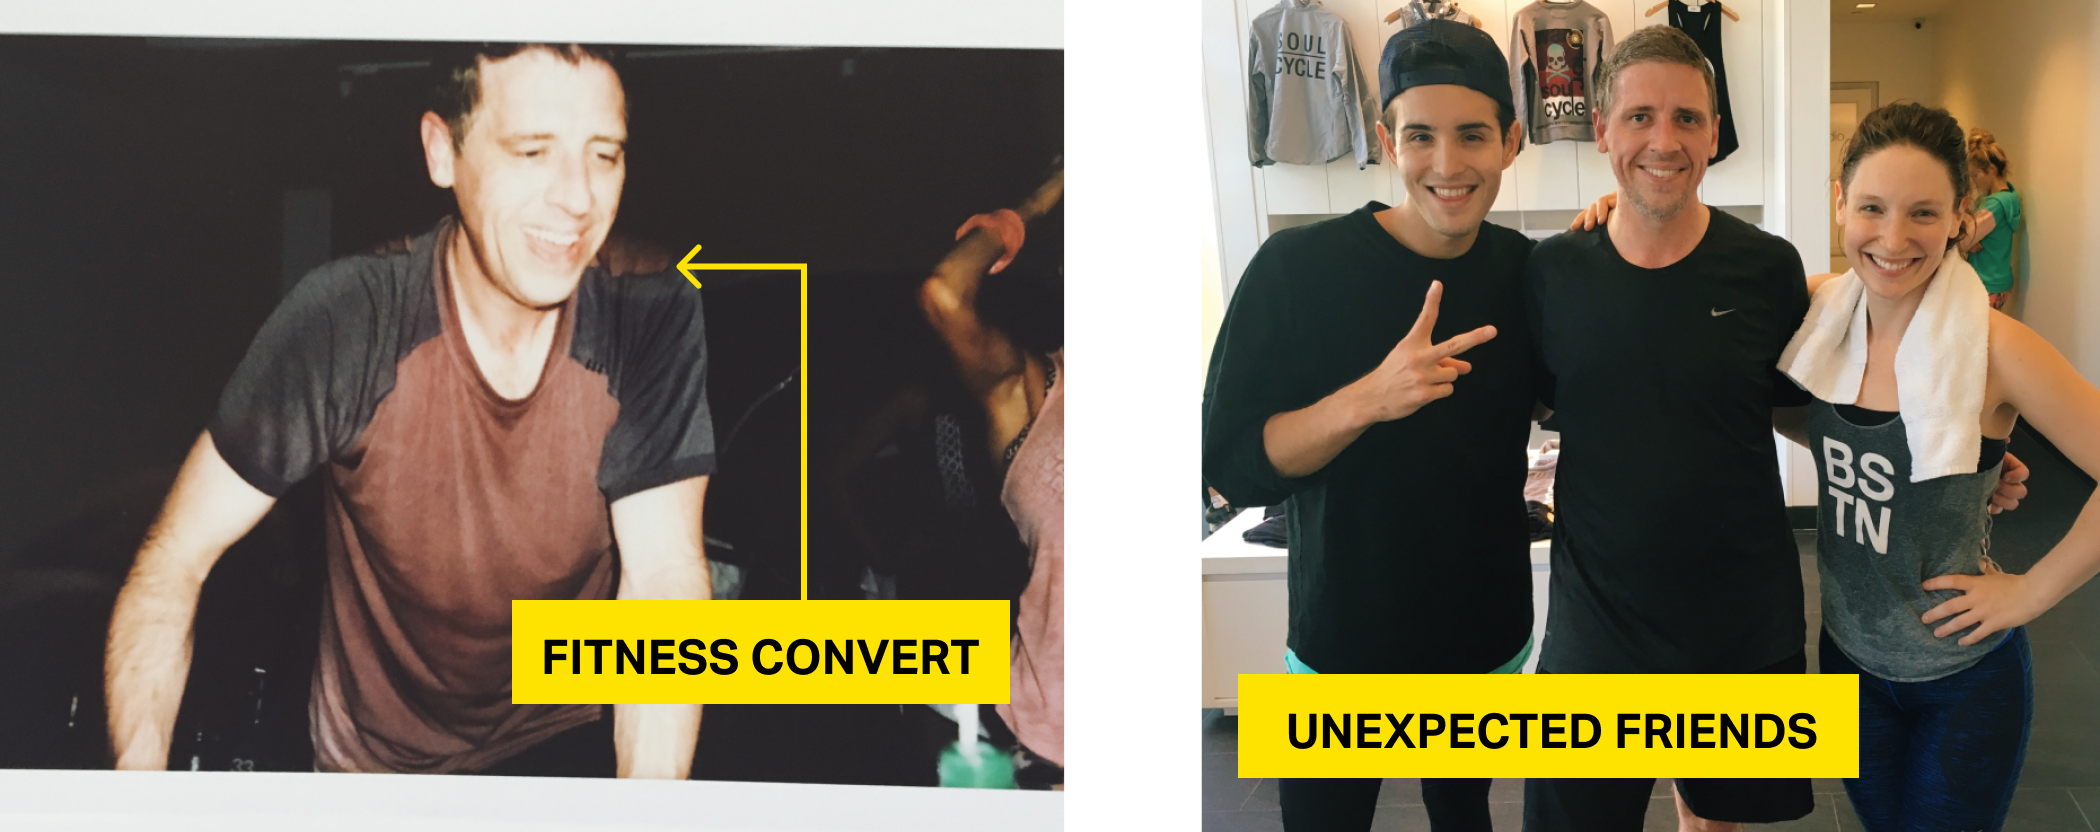
Culture = Brand

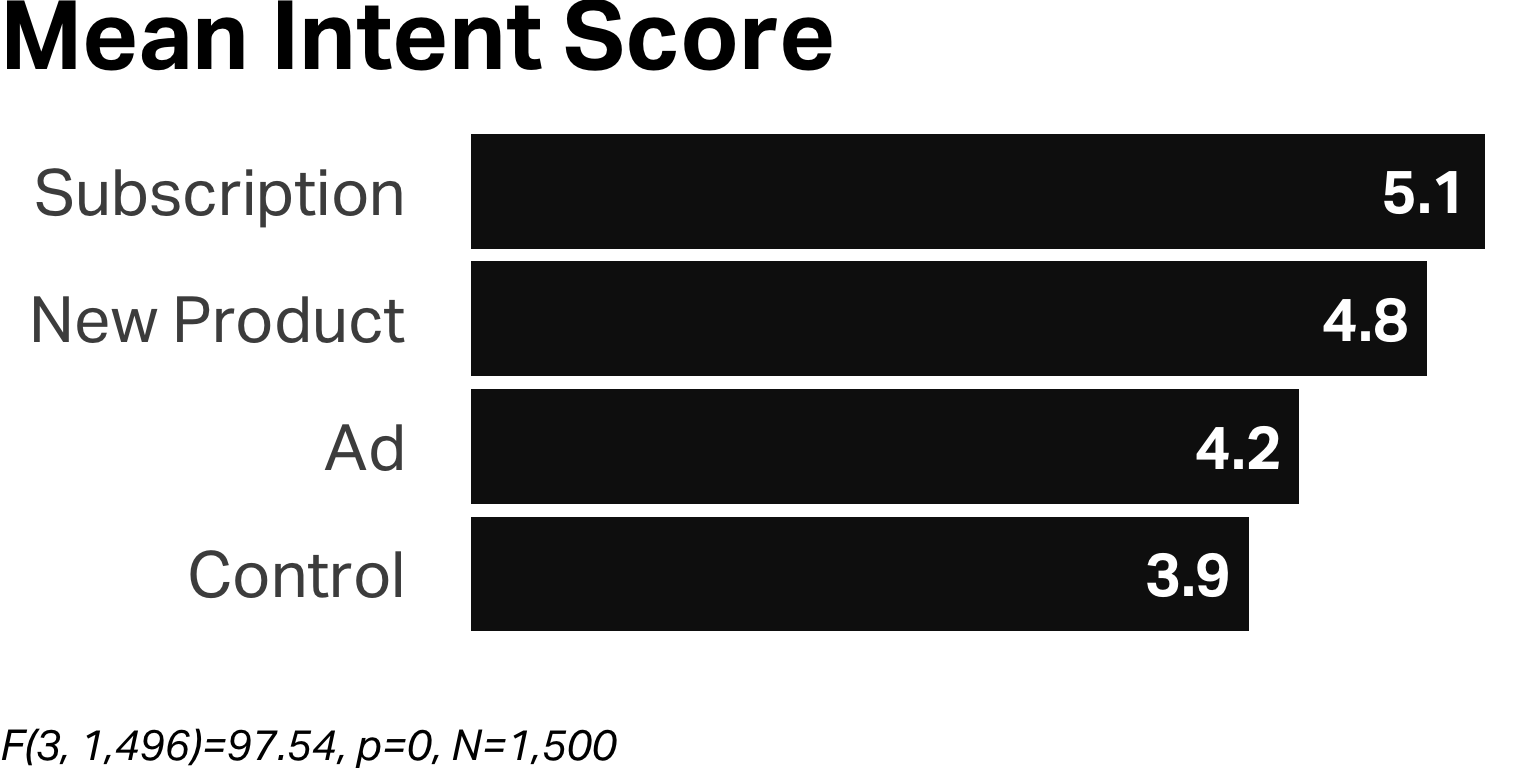
Stress tests

Stress tests

Service Profit Chain
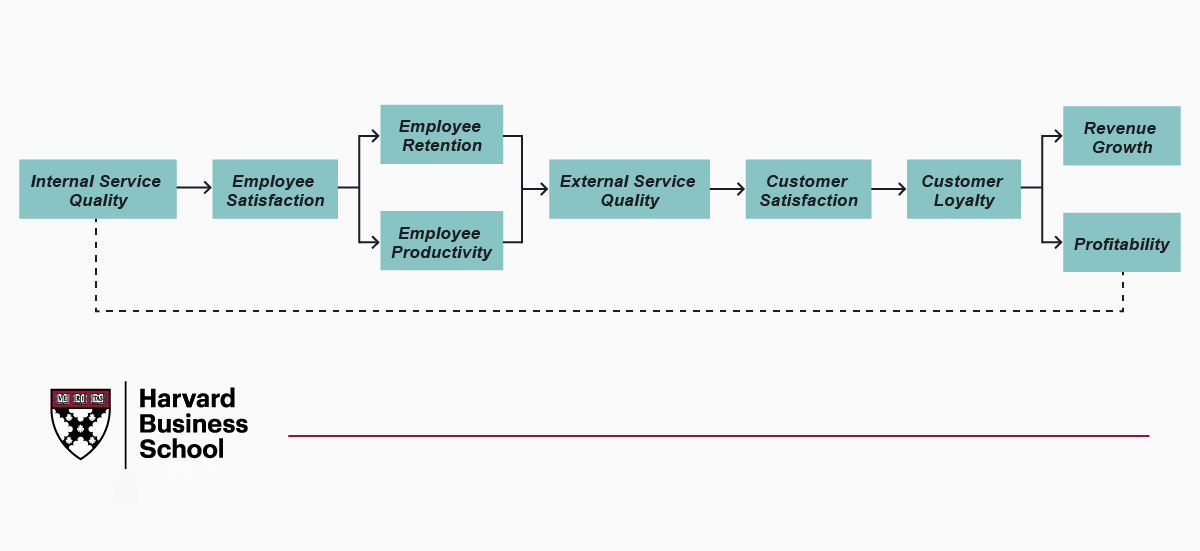
Source: Heskett, Sasser, and Schlesinger, 1994