| mean | sd | median | min | max | |
|---|---|---|---|---|---|
| trans_after | 0.14 | 0.42 | 0.00 | 0.00 | 5.00 |
| revenue_after | 7.66 | 23.63 | 0.00 | 0.00 | 247.96 |
| test_coupon | 0.50 | 0.50 | 1.00 | 0.00 | 1.00 |
| channel_acq | 2.07 | 1.05 | 2.00 | 1.00 | 5.00 |
| num_past_purch | 2.06 | 2.56 | 1.00 | 0.00 | 22.00 |
| spent_last_purchase | 57.42 | 55.47 | 56.99 | 0.00 | 361.96 |
| weeks_since_visit | 3.22 | 2.26 | 3.00 | 0.00 | 7.00 |
| browsing_minutes | 13.69 | 6.96 | 14.00 | 1.00 | 37.00 |
| shopping_cart | 0.29 | 0.46 | 0.00 | 0.00 | 1.00 |
Ethics in marketing research
Overview
Understanding the complications and unintended consequences of marketing research and data.
Presented by:
Larry Vincent,
Professor of the Practice of Marketing
Larry Vincent,
Professor of the Practice of Marketing
Presented to:
MKT 512
April 23, 2026
MKT 512
April 23, 2026

Artea
Situation
13%
The experiment
Alex Campbel, CEO of Artea, wants to know whether a 20% off coupon would convert recent non-purchasers into buyers. She runs an A/B test to find out.
Sample
5,000 users who visited Artea in last 2 months but did not transact
Randomly assigned to treatment or control
Dependent Variables
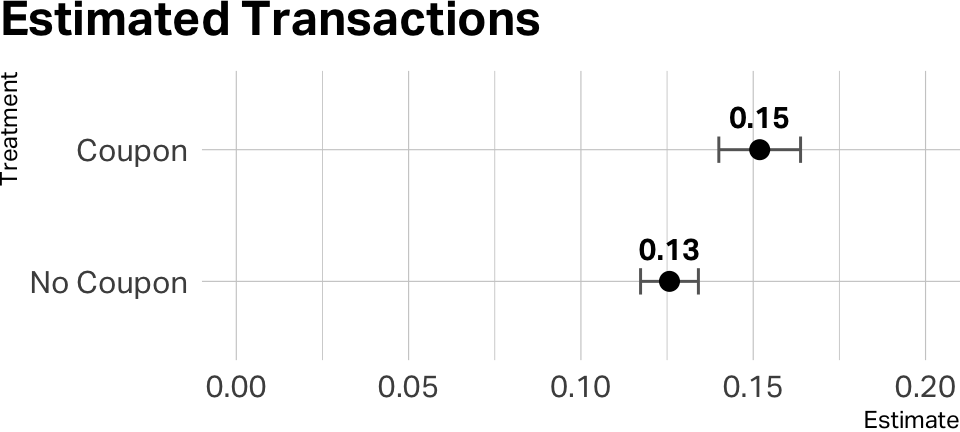
Number of transactions (trans_after) in the 30 days following the experiment
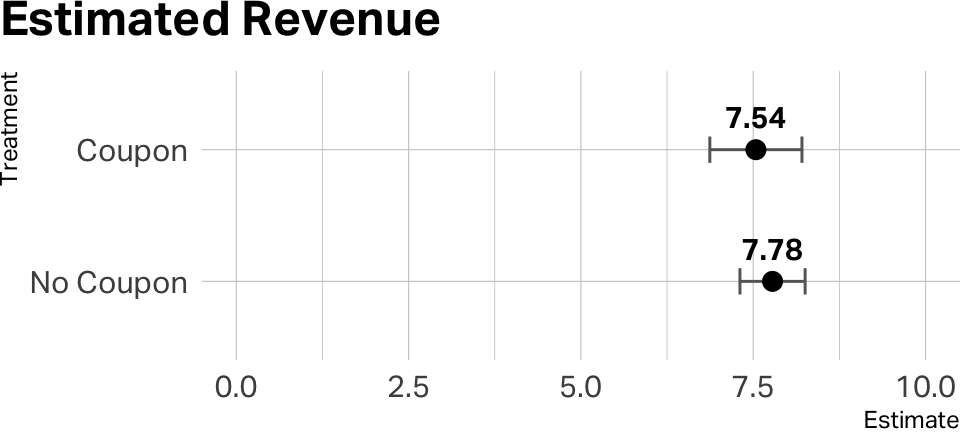
Total revenue (revenue_after) in the 30 days following the experiment
Experimental Treatments
Control: no coupon (n = 2,498)
Treatment: 20% off coupon, valid for 30 days, non-transferable (n = 2,502)
Predictors collected at time of experiment
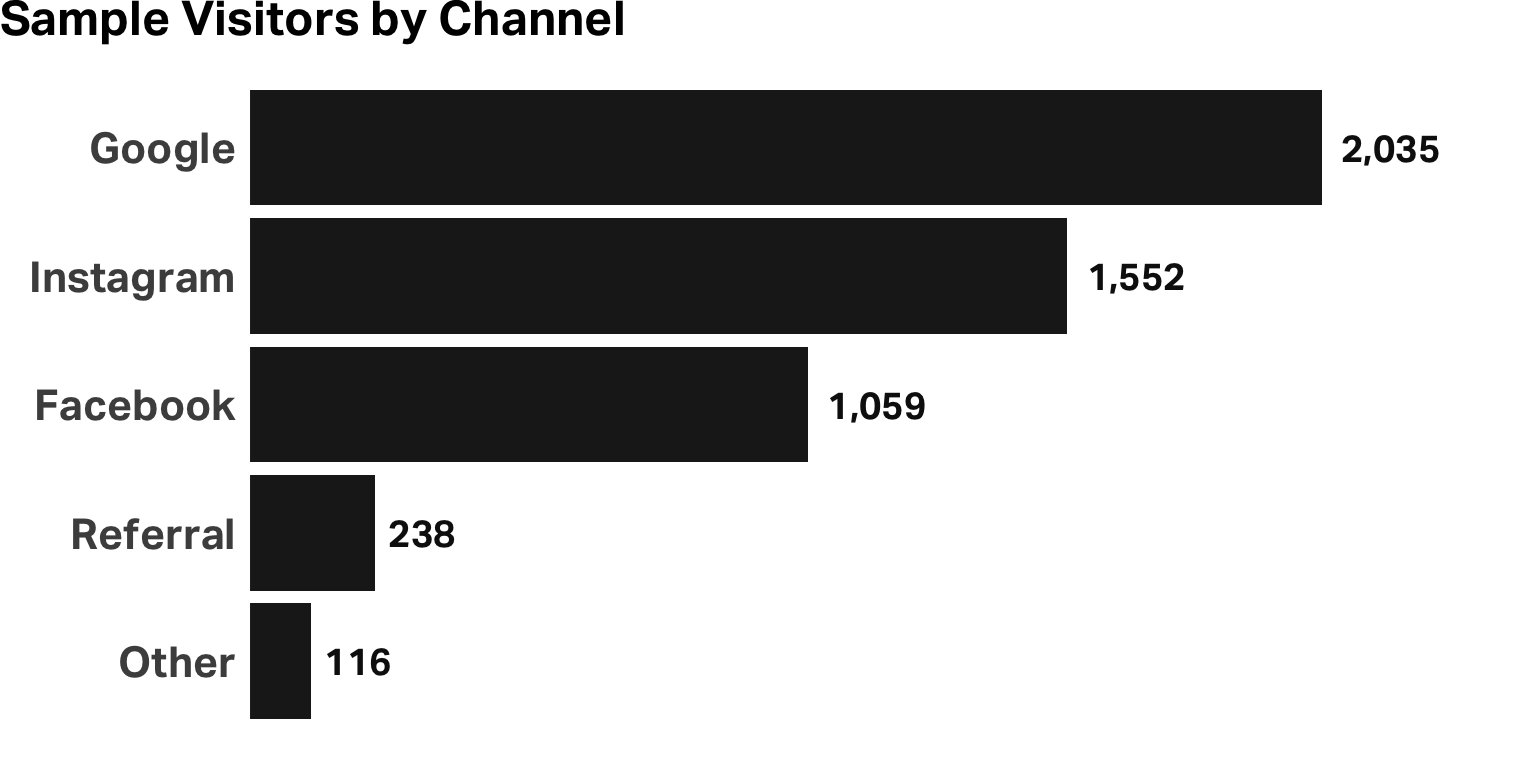
Acquisition channel (Google, Facebook, Instagram, Referral, Other)
Past behavior: # past purchases, last purchase amount, weeks since last visit, browsing minutes, shopping cart status
The Data
Randomization Check
| Test Coupon | |
|---|---|
| channel_acq | 0.00 |
| num_past_purch | 0.00 |
| spent_last_purchase | 0.00 |
| weeks_since_visit | 0.00 |
| browsing_minutes | -0.00 |
| shopping_cart | -0.02 |
| Num.Obs. | 5000 |
| R2 | 0.001 |
| R2 Adj. | -0.000 |
| F | 0.685 |
Regression Model
| TX After | $ After | |
|---|---|---|
| test_coupon | 0.03* | -0.24 |
| Num.Obs. | 5000 | 5000 |
| R2 | 0.001 | 0.000 |
| R2 Adj. | 0.001 | -0.000 |
| F | 4.872 | 0.131 |
Predictor influence
| TX After | ||
| Coupon Only | All Predictors | |
|---|---|---|
| test_coupon | 0.03* | 0.03* |
| channel_acqFacebook | 0.11*** | |
| channel_acqInstagram | 0.11*** | |
| channel_acqReferral | 0.13*** | |
| channel_acqOther | 0.16*** | |
| num_past_purch | 0.06*** | |
| spent_last_purchase | -0.00*** | |
| weeks_since_visit | -0.02*** | |
| browsing_minutes | 0.00*** | |
| shopping_cart | 0.17*** | |
| Num.Obs. | 5000 | 5000 |
| R2 | 0.001 | 0.177 |
| R2 Adj. | 0.001 | 0.176 |
| F | 4.872 | 107.660 |
| * p < 0.1, ** p < 0.05, *** p < 0.01 | ||
| Revenue After | ||
| Coupon Only | All Predictors | |
|---|---|---|
| test_coupon | -0.24 | -0.28 |
| channel_acqFacebook | 6.04*** | |
| channel_acqInstagram | 5.98*** | |
| channel_acqReferral | 6.66*** | |
| channel_acqOther | 8.70*** | |
| num_past_purch | 3.17*** | |
| spent_last_purchase | -0.01* | |
| weeks_since_visit | -1.11*** | |
| browsing_minutes | 0.16*** | |
| shopping_cart | 9.31*** | |
| Num.Obs. | 5000 | 5000 |
| R2 | 0.000 | 0.171 |
| R2 Adj. | -0.000 | 0.170 |
| F | 0.131 | 103.052 |
| * p < 0.1, ** p < 0.05, *** p < 0.01 | ||
Which channel is best?
Channel proportions
Acquisition effects
Acquisition effects
| TX After | ||
| Coupon Only | Channels | |
|---|---|---|
| test_coupon | 0.03* | 0.02* |
| channel_acqFacebook | 0.12*** | |
| channel_acqInstagram | 0.11*** | |
| channel_acqReferral | 0.14*** | |
| channel_acqOther | 0.18*** | |
| Num.Obs. | 5000 | 5000 |
| R2 | 0.001 | 0.021 |
| R2 Adj. | 0.001 | 0.020 |
| F | 4.872 | 21.411 |
| Revenue After | ||
| Coupon Only | Channels | |
|---|---|---|
| test_coupon | -0.24 | -0.30 |
| channel_acqFacebook | 6.50*** | |
| channel_acqInstagram | 5.87*** | |
| channel_acqReferral | 7.49*** | |
| channel_acqOther | 9.94*** | |
| Num.Obs. | 5000 | 5000 |
| R2 | 0.000 | 0.018 |
| R2 Adj. | -0.000 | 0.017 |
| F | 0.131 | 18.771 |
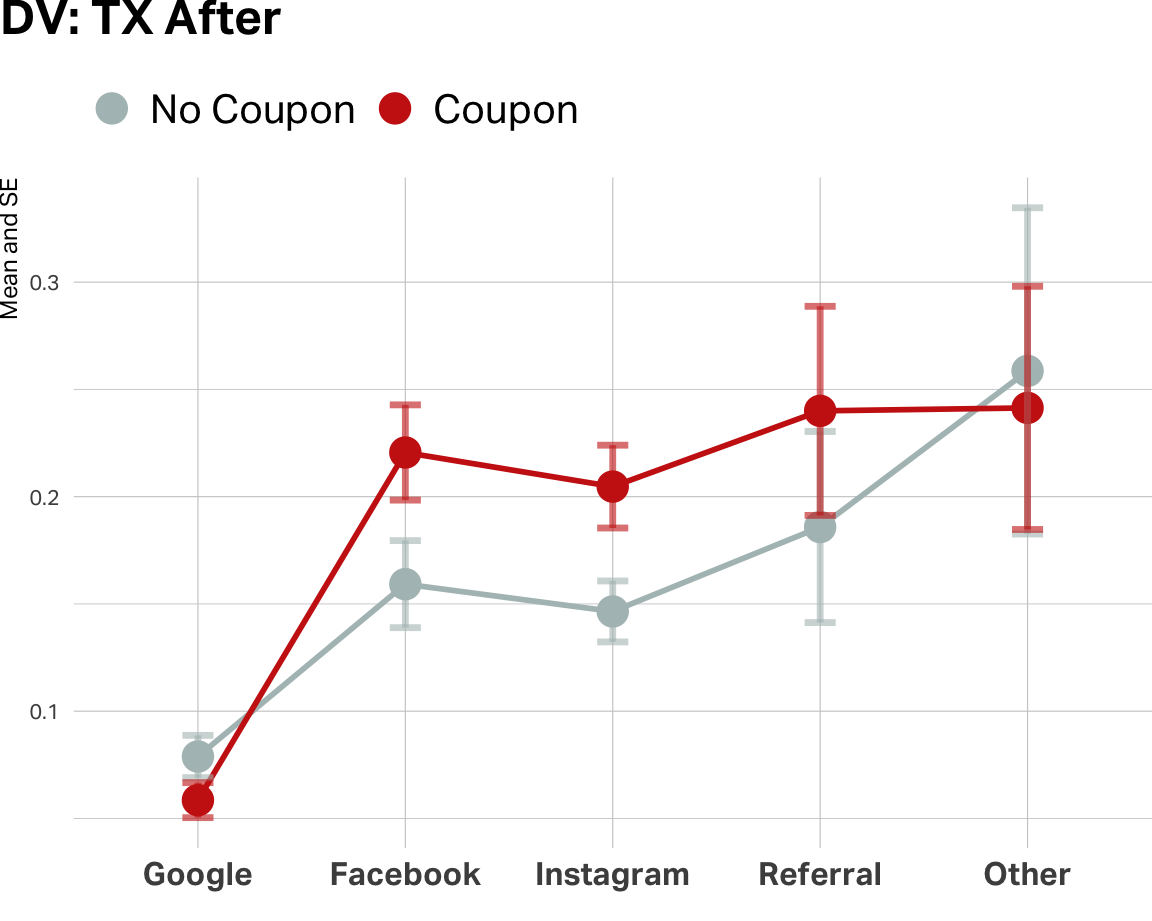
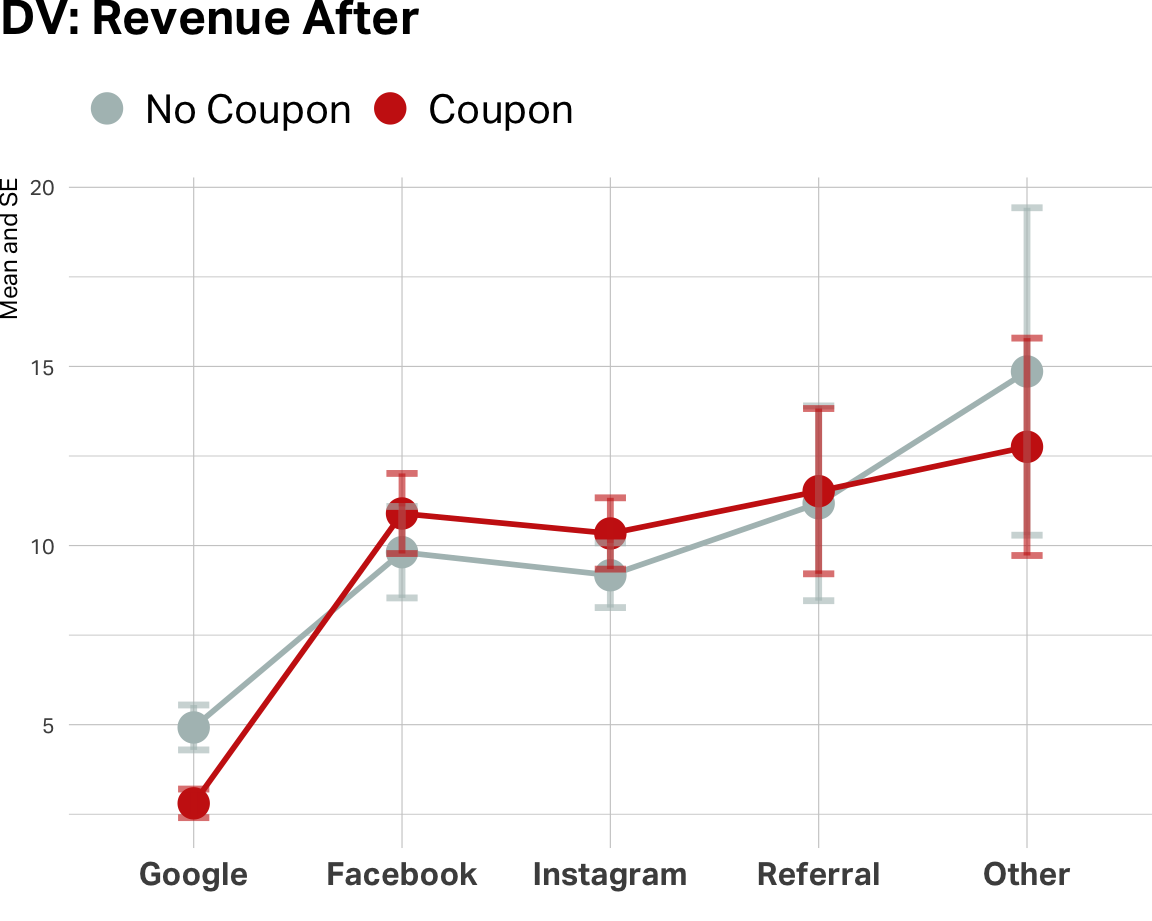
Channel interactions
| TX After | ||
| Coupon Only | Channels | |
|---|---|---|
| test_coupon | 0.02* | -0.02 |
| channel_acqFacebook | 0.12*** | 0.08*** |
| channel_acqInstagram | 0.11*** | 0.07*** |
| channel_acqReferral | 0.14*** | 0.11** |
| channel_acqOther | 0.18*** | 0.18** |
| test_coupon × channel_acqFacebook | 0.08** | |
| test_coupon × channel_acqInstagram | 0.08** | |
| test_coupon × channel_acqReferral | 0.07 | |
| test_coupon × channel_acqOther | 0.00 | |
| Num.Obs. | 5000 | 5000 |
| R2 | 0.021 | 0.023 |
| R2 Adj. | 0.020 | 0.021 |
| F | 21.411 | 13.154 |
| Revenue After | ||
| Coupon Only | Channels | |
|---|---|---|
| test_coupon | -0.30 | -2.12* |
| channel_acqFacebook | 6.50*** | 4.89*** |
| channel_acqInstagram | 5.87*** | 4.25*** |
| channel_acqReferral | 7.49*** | 6.26** |
| channel_acqOther | 9.94*** | 9.94** |
| test_coupon × channel_acqFacebook | 3.20+ | |
| test_coupon × channel_acqInstagram | 3.28* | |
| test_coupon × channel_acqReferral | 2.46 | |
| test_coupon × channel_acqOther | 0.02 | |
| Num.Obs. | 5000 | 5000 |
| R2 | 0.018 | 0.020 |
| R2 Adj. | 0.017 | 0.018 |
| F | 18.771 | 11.068 |
Your turn
The assignment
- Break into groups
- Review all the data
- Discuss the implications and develop a targeting strategy that will outperform management’s experiment
- A bonus point for each member of the team that creates the most value
The benchmark to beat
Based on the A/B test, Artea’s analysts projected three naive strategies on the 6,000-customer campaign pool:
| Strategy | % Targeted | Total Revenue |
|---|---|---|
| Target nobody | 0% | $41,694 |
| Random 50% | 50% | $39,459 |
| Target everybody | 100% | $39,680 |
Your team’s job: build a targeting rule that beats these benchmarks.
