| Model Coefficients | ||||
| term | estimate | std.error | statistic | p.value |
|---|---|---|---|---|
| (Intercept) | 42.46 | 0.23 | 185.83 | 0.00 |
| gift | 12.48 | 0.32 | 38.84 | 0.00 |
Experiments
Overview
Split and A/B Testing designs to derive inferences about customer behavior.
Presented by:
Larry Vincent,
Professor of the Practice
Marketing
Larry Vincent,
Professor of the Practice
Marketing
Presented to:
MKT 512
April 2, 2026
MKT 512
April 2, 2026

Core Elements
- Independent and dependent variables
(predictive and response variables) - Control and experimental groups
- Randomization
Example

Example
School supplies company wants to test optimal color scheme for new line of backpacks, geared toward high school market. Three schemes developed following qualitative research.
| Element | Execution |
|---|---|
| Independent variables | Age, Gender, Grade Level, Collage Image of Backpack Design |
| Dependent variables | Intent to Purchase score |
| Control/Experimental Groups | Participants randomly assigned to one of three groups, each group was only shown one backpack design scheme for evaluation |
| Randomization | Randomization: 750 US teenagers age 15-18 randomly sampled from an online sample provider |
Discussion:
- What other factors might accidentally influence the results?
- If we wanted to test price sensitivity too, how would we modify this design?
- For 3 color schemes, why did they choose 750 participants? Would you want more or fewer?
Data types

Common dependent variables
- Intent to purchase (intent to re-purchase)
- Net Promoter Score
- Satisfaction (CSAT)
- Affect (likability, sentiment, love, admiration, delight, concern, aversion etc.)
- Credibility (trust, perceived expertise, perceived quality, etc.)
A/B testing
- Most common experimental design
(also known as split testing) - Manipulates only one independent variable (predictor) to assess changes in one dependent variable (DV)
- Requires two versions with one distinct difference between
- Difference should be randomly dispersed between an equal number of participants
- Typically measured for statistical significance and effect
A/B testing
| Situation | Online retailer wants to test the impact of a “value add” coupon after 2 purchases. |
| Hypothesis | Coupon will increase spending in subsequent purchases. |
| Method | Random sample of 1,000 customers. Half receive thank you note with coupon; half receive just a thank you note. Revenue measured 60 days after exposure. |
| Model Fit | |||||
| r.squared | adj.r.squared | sigma | statistic | p.value | df |
|---|---|---|---|---|---|
| 0.60 | 0.60 | 5.08 | 1,508.80 | 0.00 | 1 |
Factorial design
- Manipulates more than one IV
- Usually tracks changes in one DV
- Example: How are sales affected by changes in packaging and promotional concepts?
Factorial design
| Situation | CPG company wishes to test a new campaign on Amazon that also includes new branding on packages. |
| Hypothesis | Both the campaign and new packaging will increase sales. |
| Method | Random sample of 1,000 customers. 2x2 design with each respondent seeing only one Amazon ad (A-Existing vs. B-New) and one package design (Y-Existing vs Z-New). |
| Model Coefficients | ||||
| term | estimate | std.error | statistic | p.value |
|---|---|---|---|---|
| (Intercept) | 17.67 | 0.03 | 653.02 | 0.00 |
| promoB | −1.88 | 0.03 | −60.26 | 0.00 |
| packageZ | 1.98 | 0.03 | 63.76 | 0.00 |
| Model Fit | |||||
| r.squared | adj.r.squared | sigma | statistic | p.value | df |
|---|---|---|---|---|---|
| 0.88 | 0.88 | 0.49 | 3,723.32 | 0.00 | 2 |
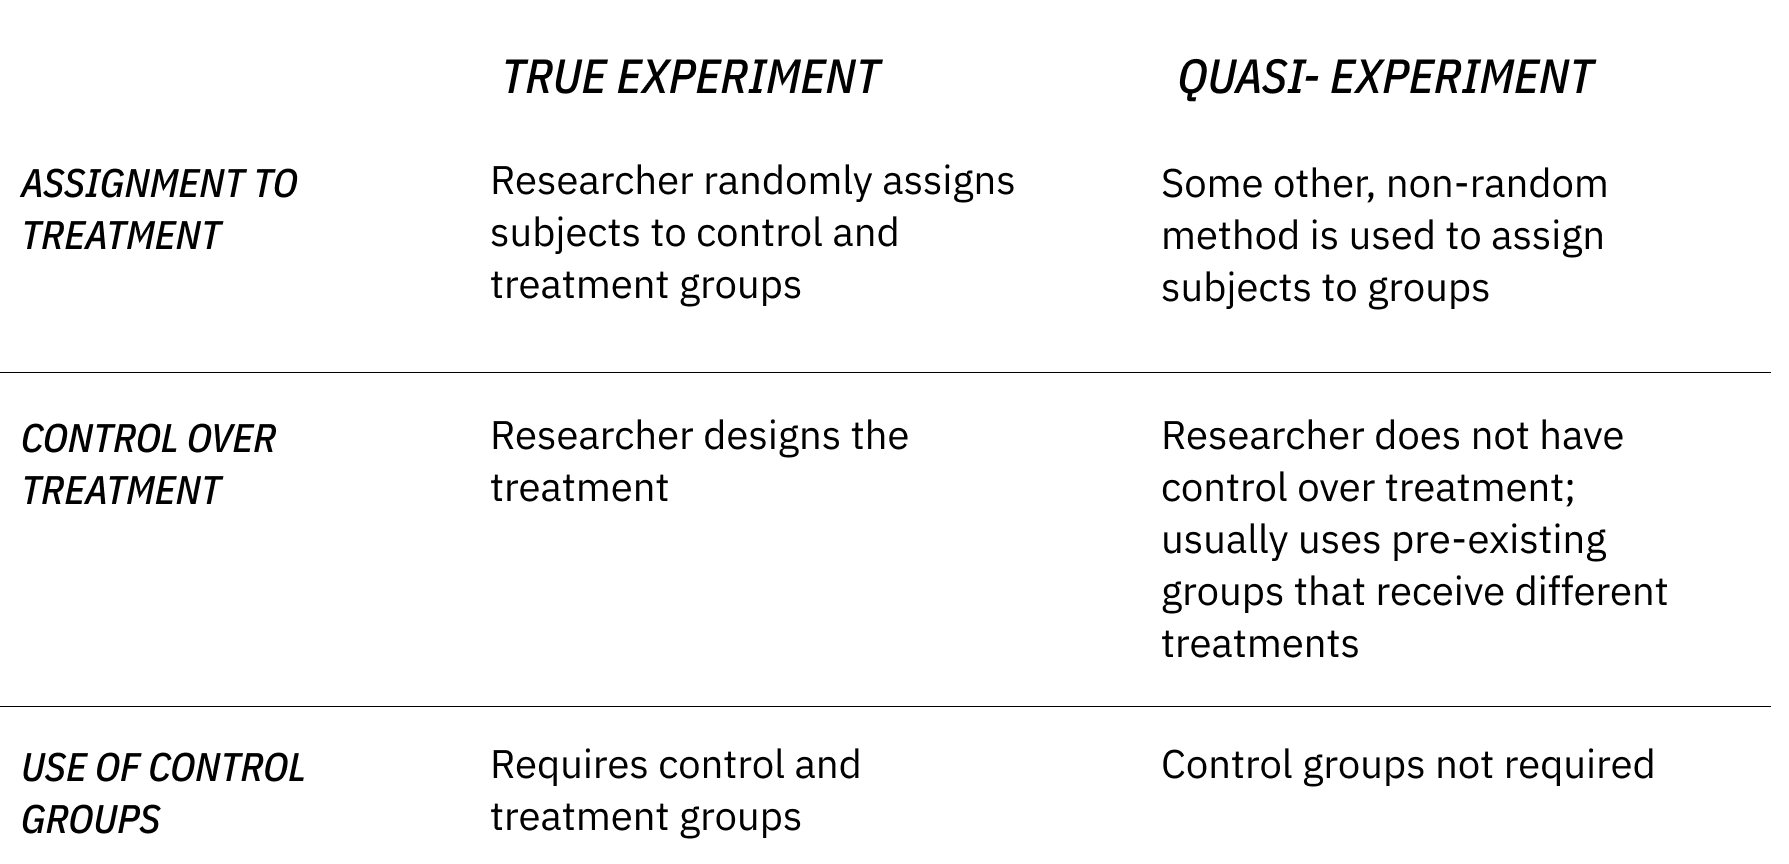
Experiments vs. quasi-experiments