| Variable | Median | Mean | SD | Min | Max | NAs |
|---|---|---|---|---|---|---|
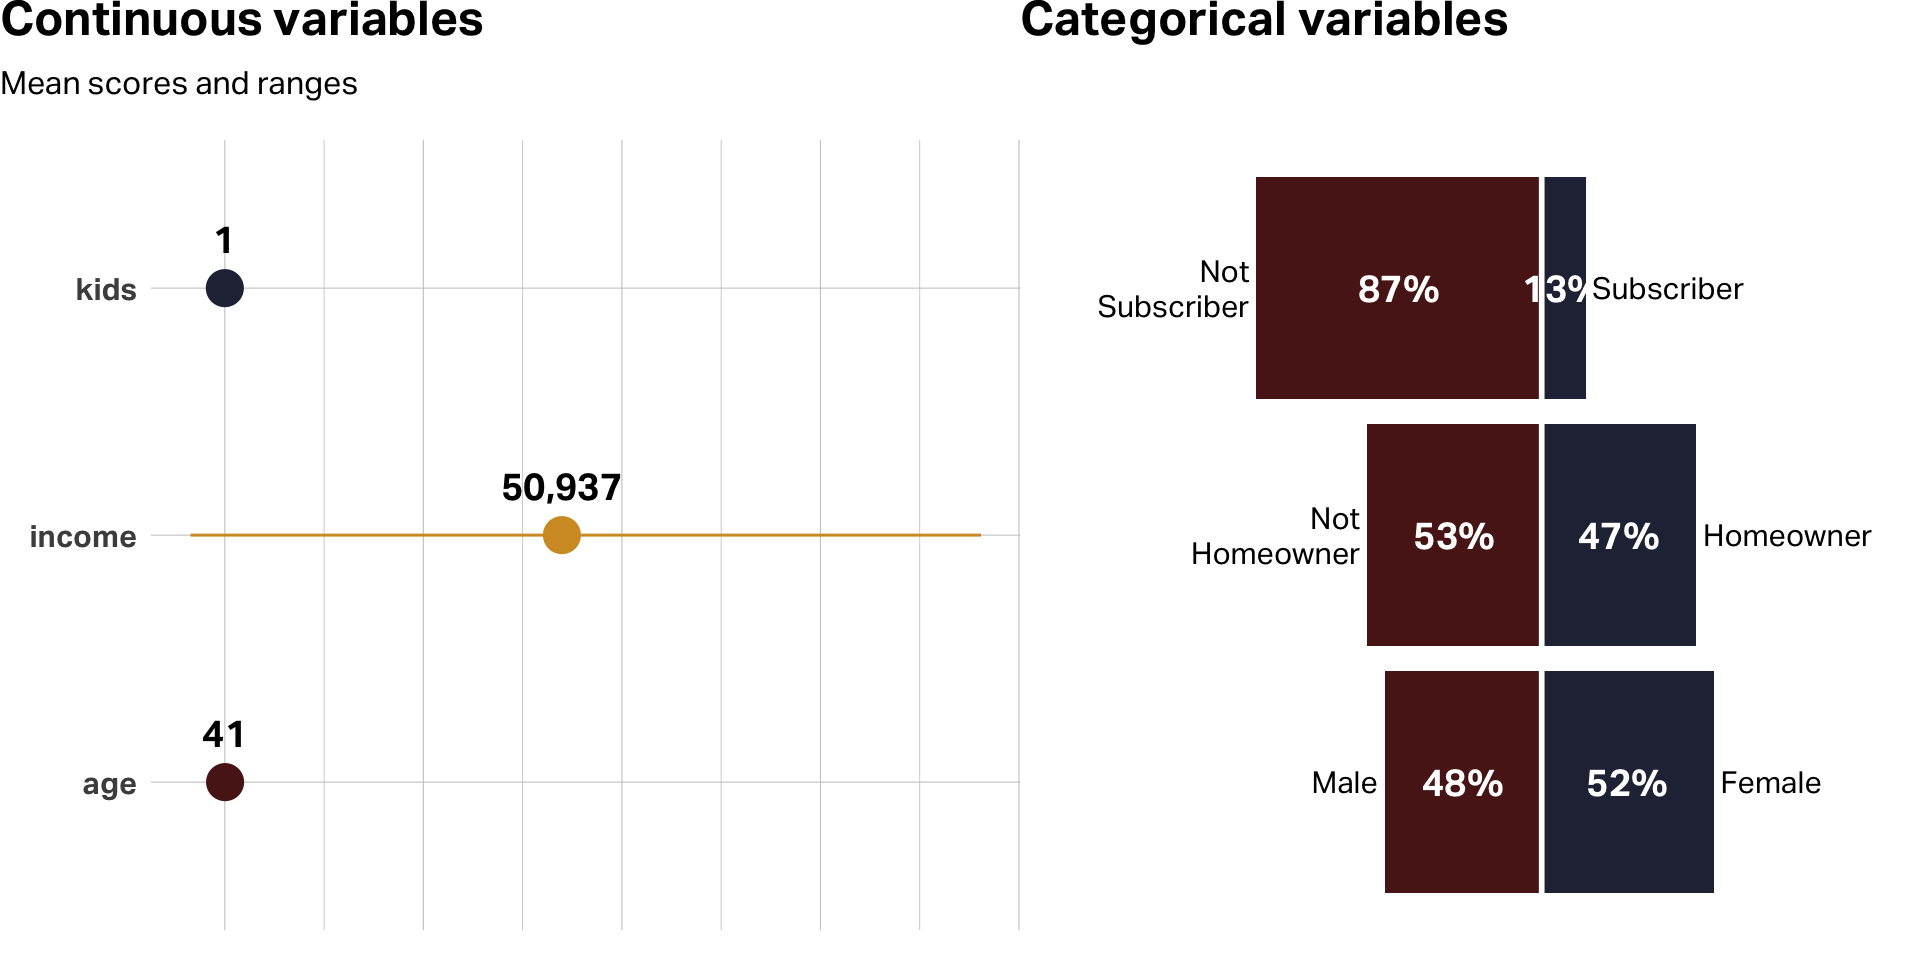
| age | 39 | 41.2 | 12.7 | 19 | 80 | 0 |
| female | 1 | 0.5 | 0.5 | 0 | 1 | 0 |
| income | 52,014 | 50,936.5 | 20,137.5 | −5,183 | 114,278 | 0 |
| kids | 1 | 1.3 | 1.4 | 0 | 7 | 0 |
| own_home | 0 | 0.5 | 0.5 | 0 | 1 | 0 |
| subscribe | 0 | 0.1 | 0.3 | 0 | 1 | 0 |
Clustering Customer Data
Overview
Using unsupervised learning techniques to divide customers into meaningful groups.
Presented to:
MKT 512
February 19, 2026
MKT 512
February 19, 2026

Different data types
and scales
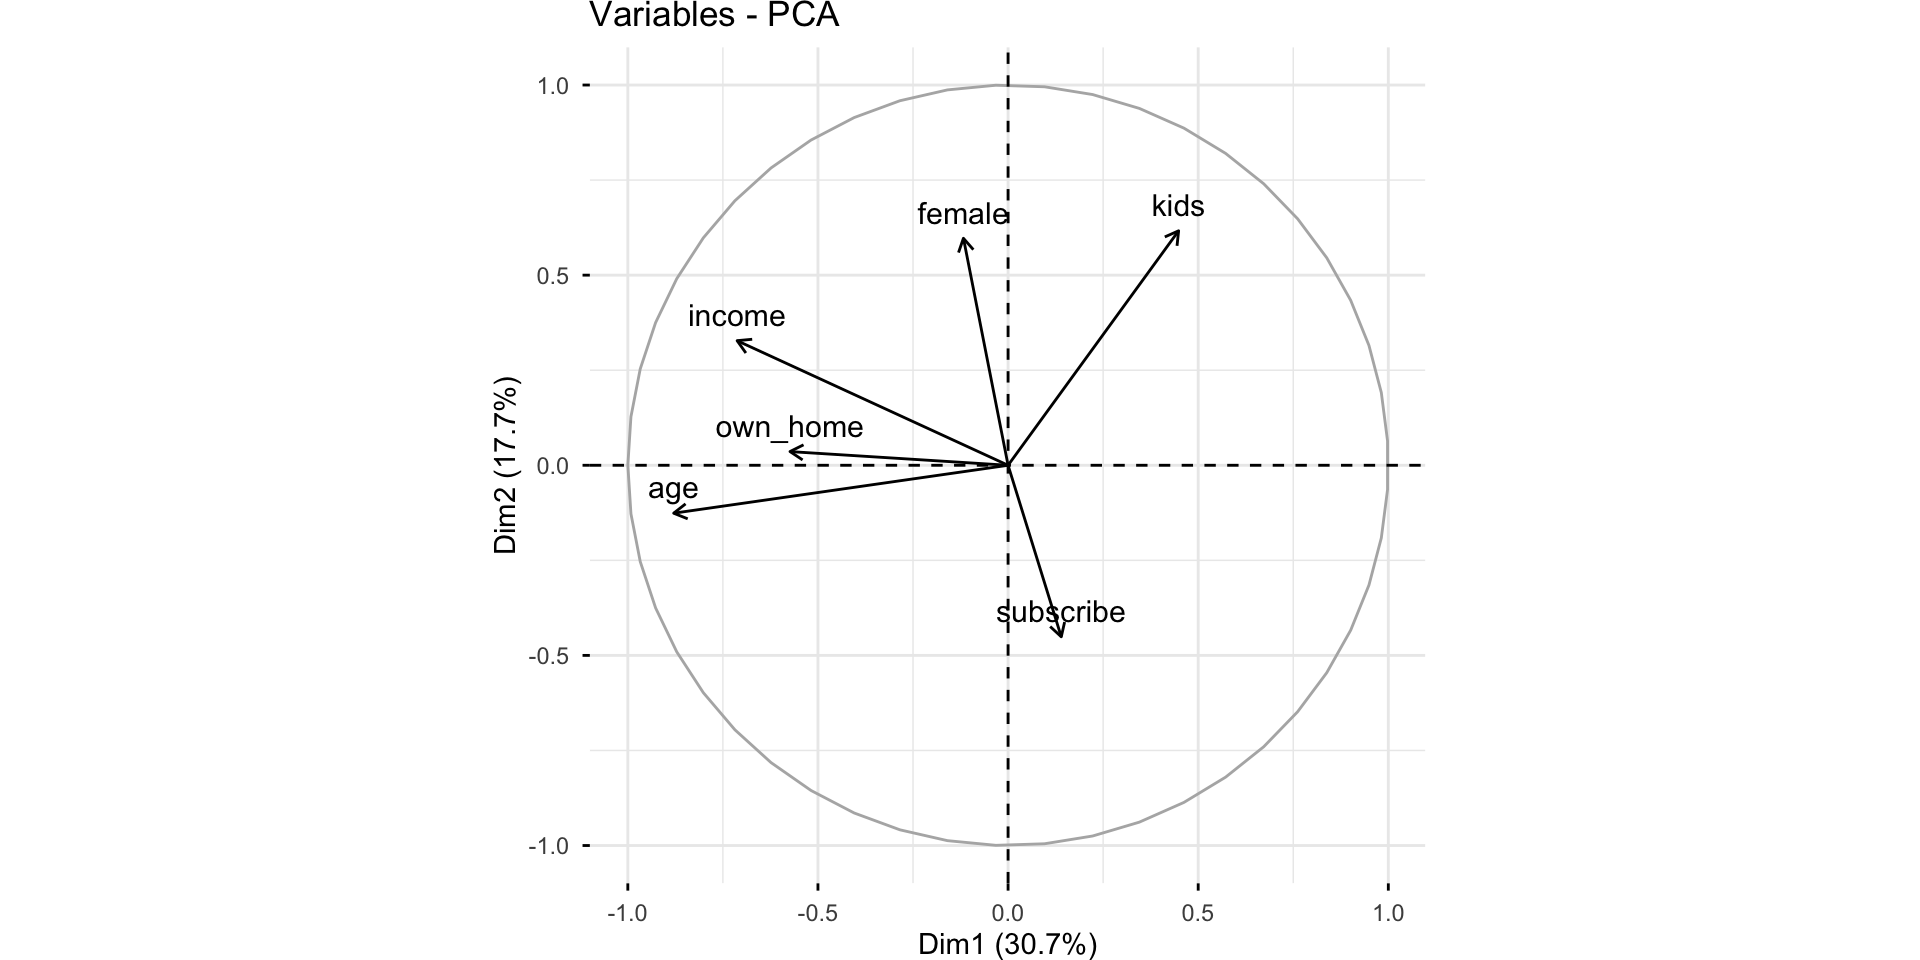
Pre-Processing with PCA
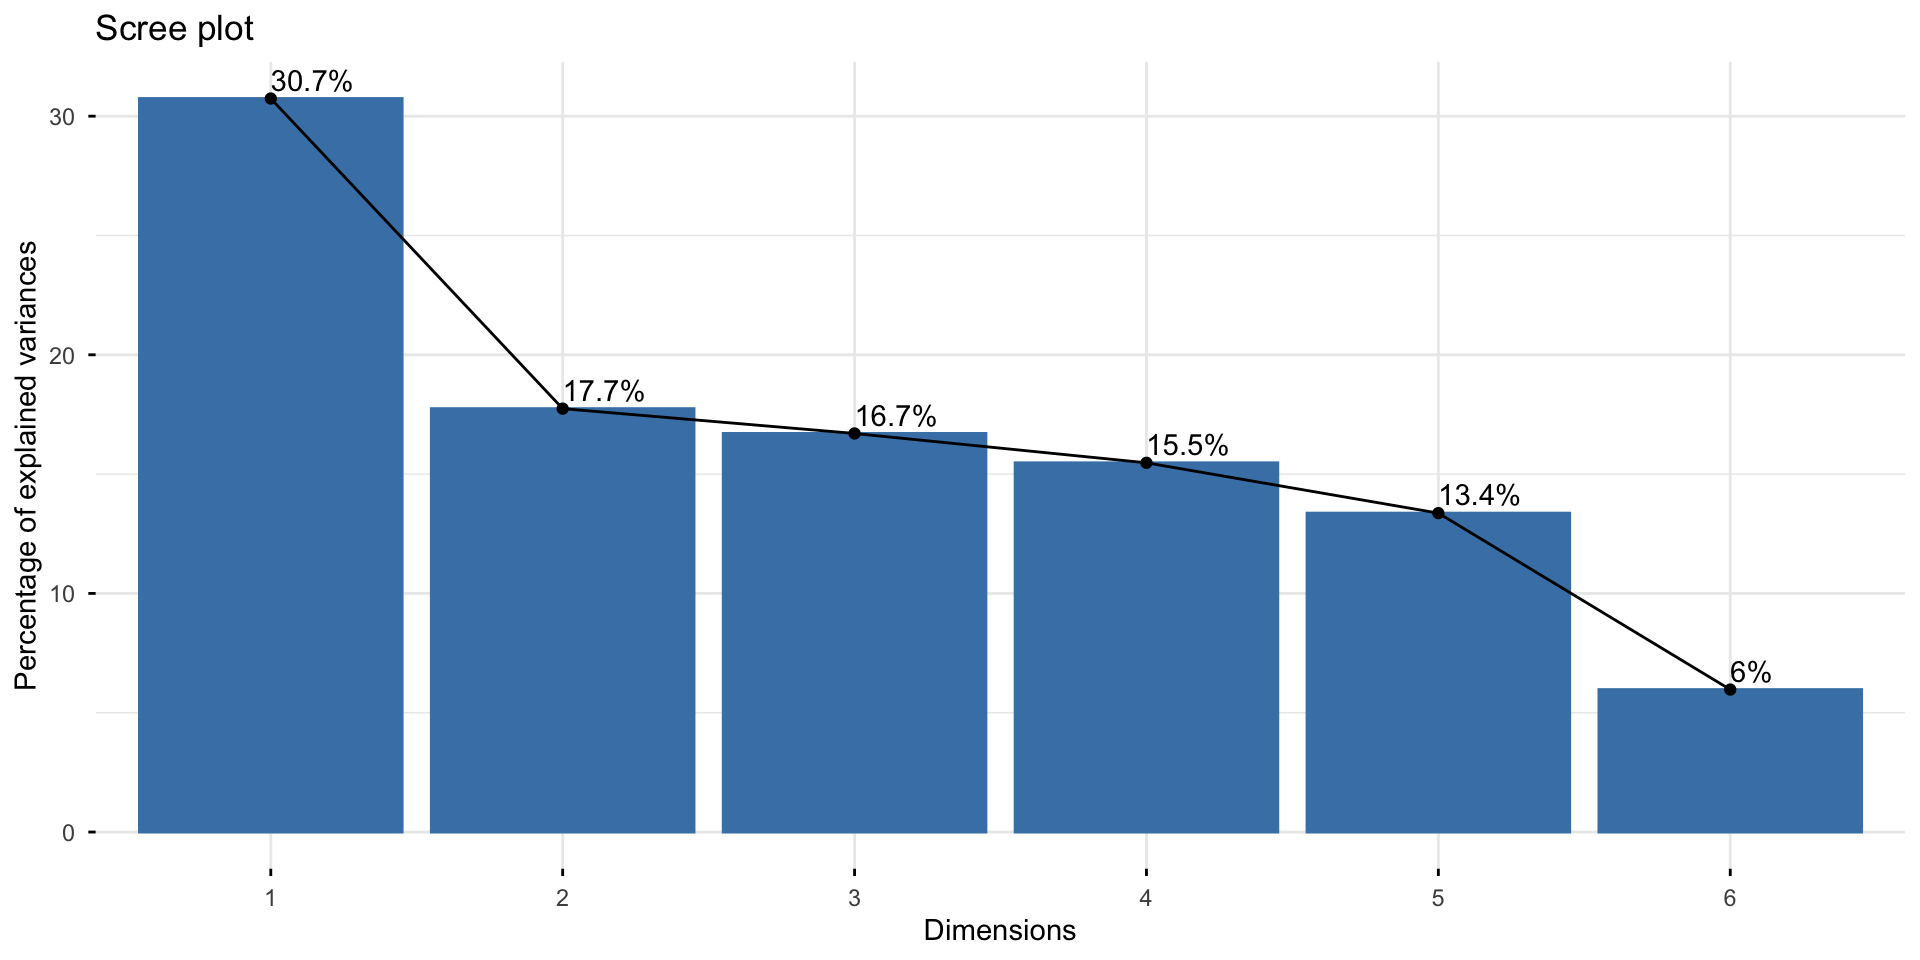
PCA
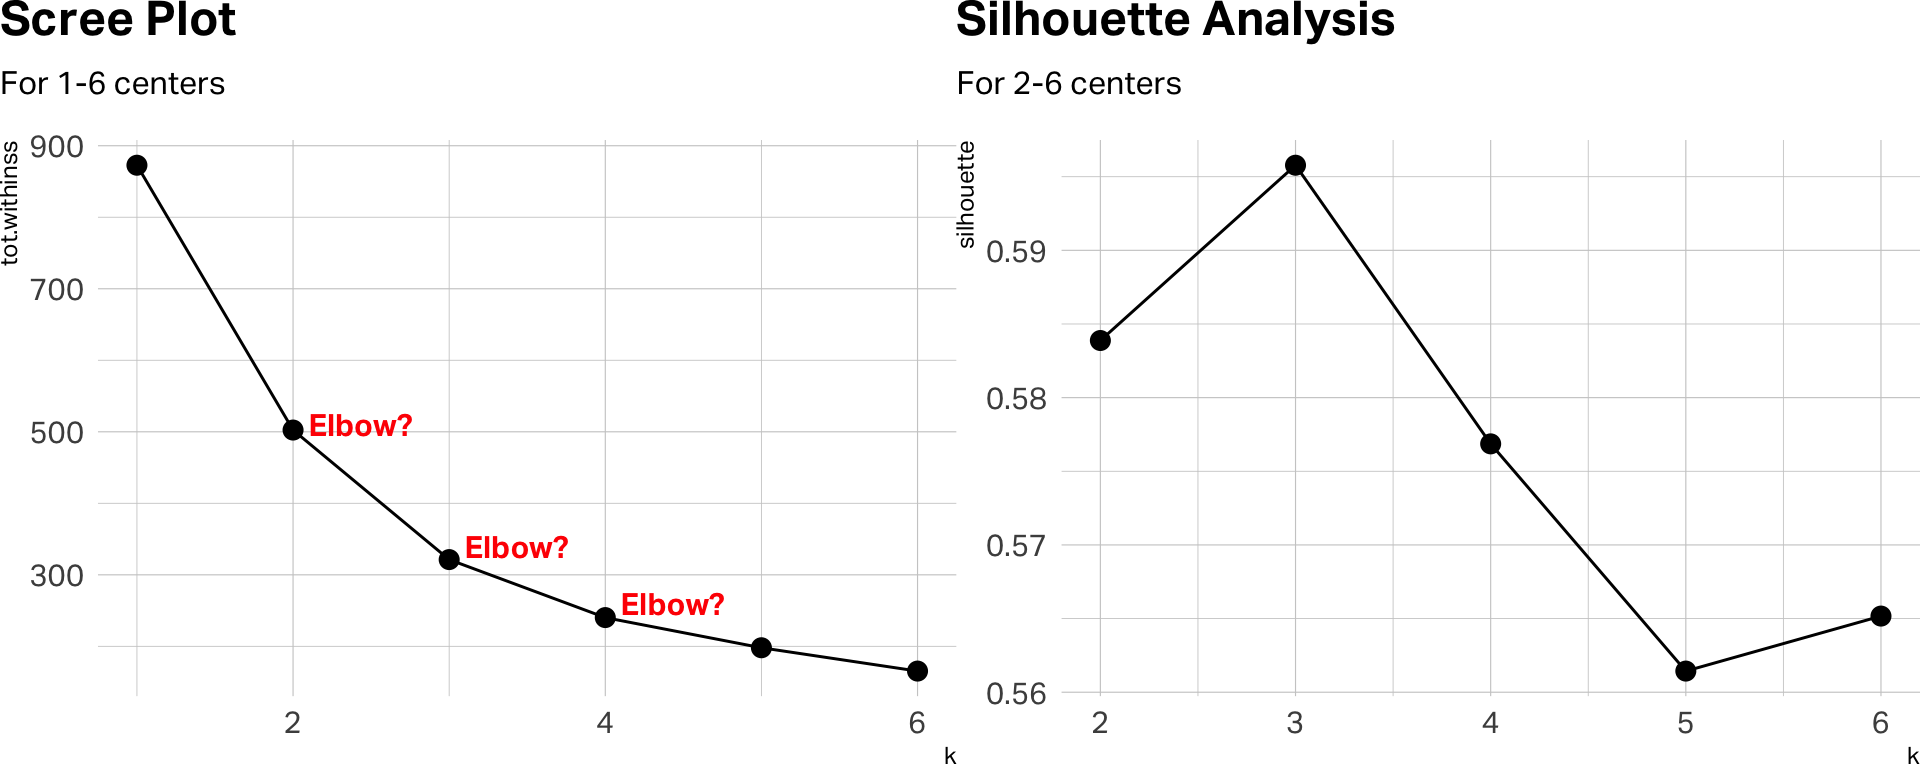
How many centers?
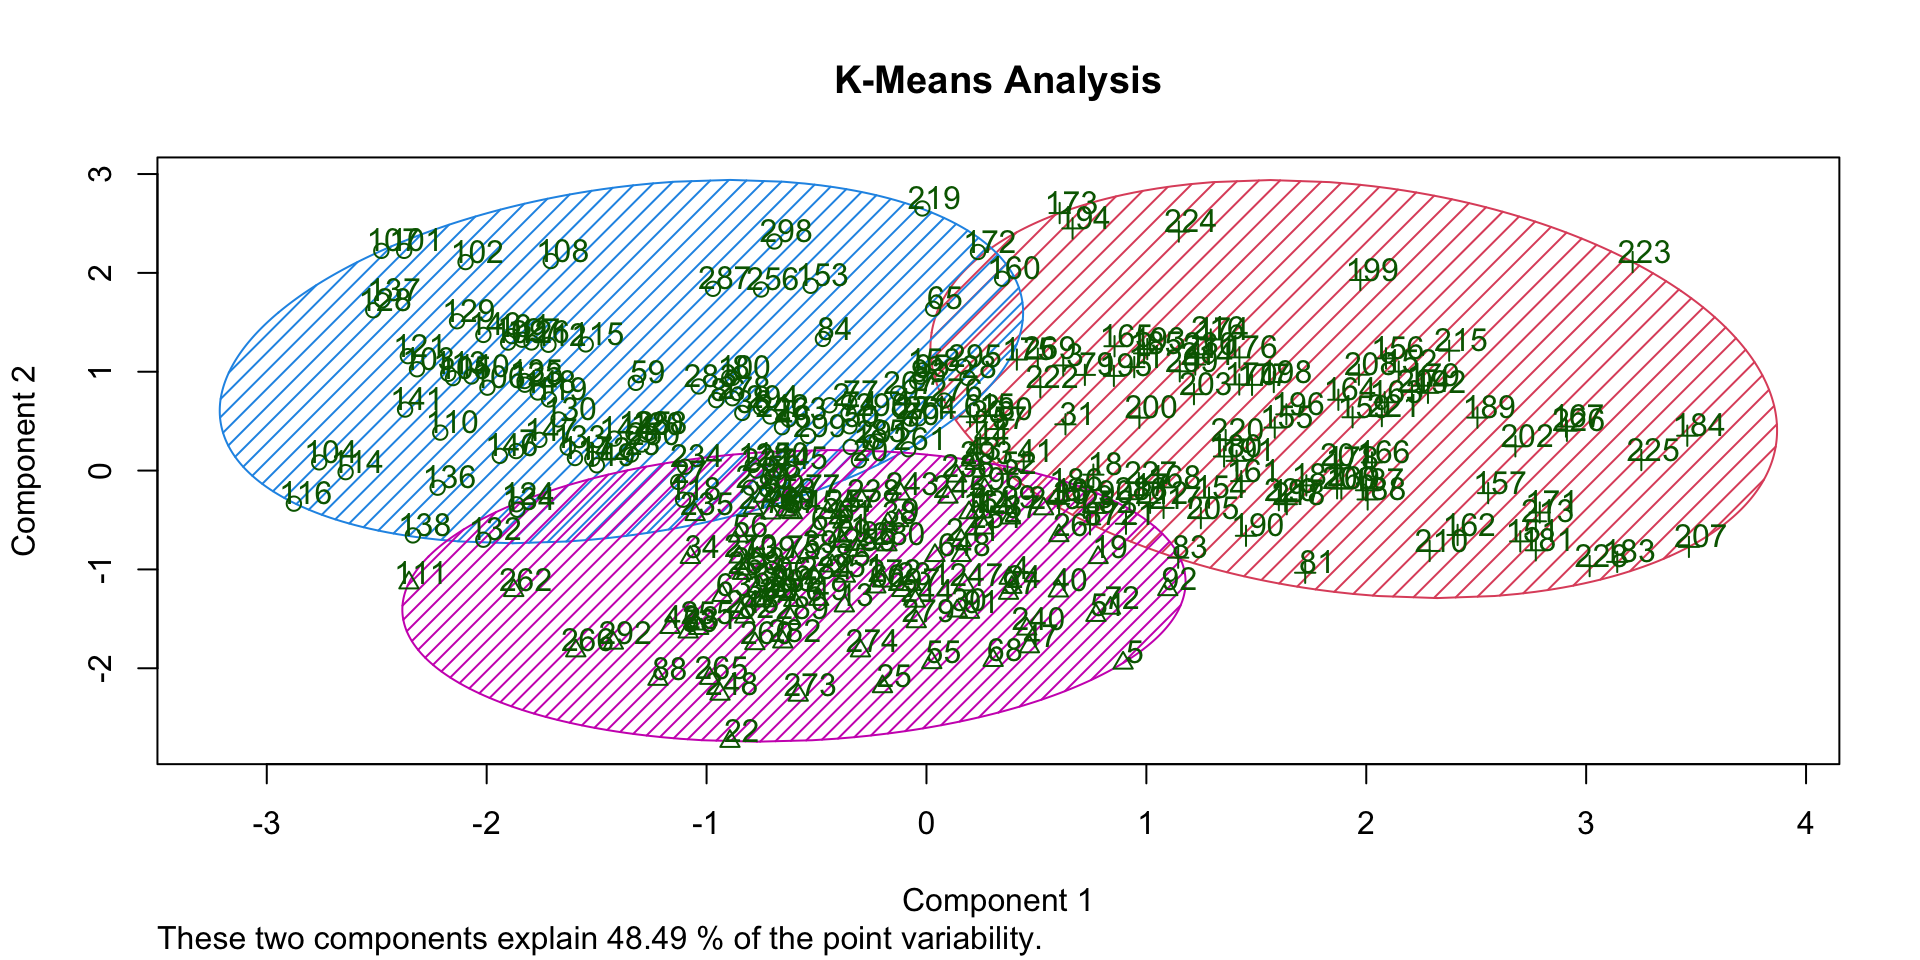
Three clusters (K-means)
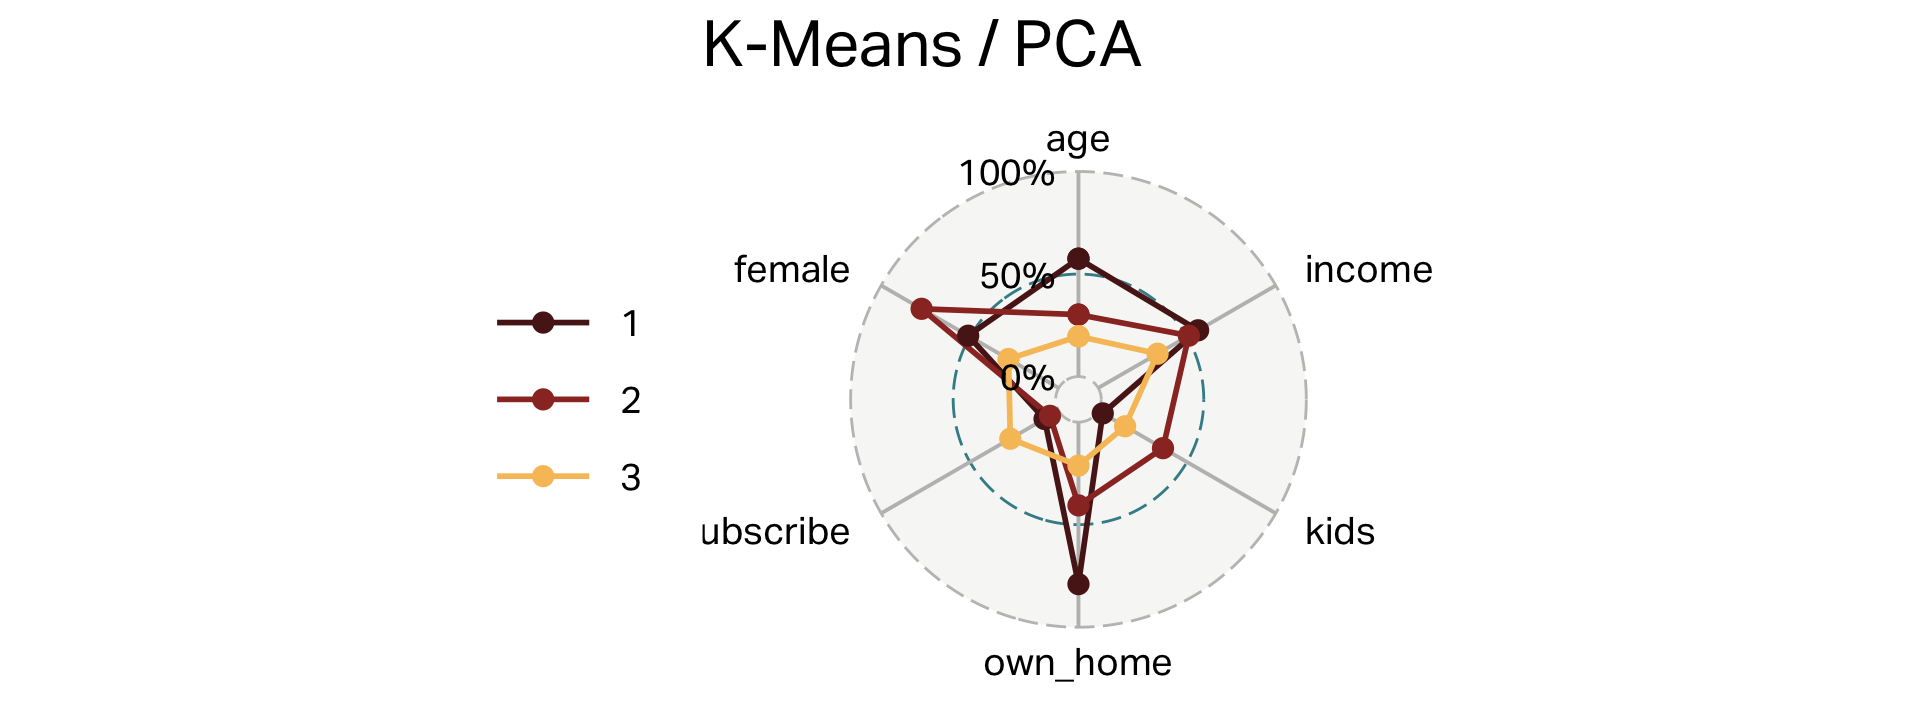
| cluster | n | age | income | kids | own_home | subscribe | female |
|---|---|---|---|---|---|---|---|
| 1 | 100 | 55 | 60,107 | 0 | 79% | 8% | 51% |
| 2 | 101 | 38 | 56,016 | 3 | 41% | 5% | 77% |
| 3 | 99 | 28 | 28,270 | 1 | 21% | 27% | 28% |
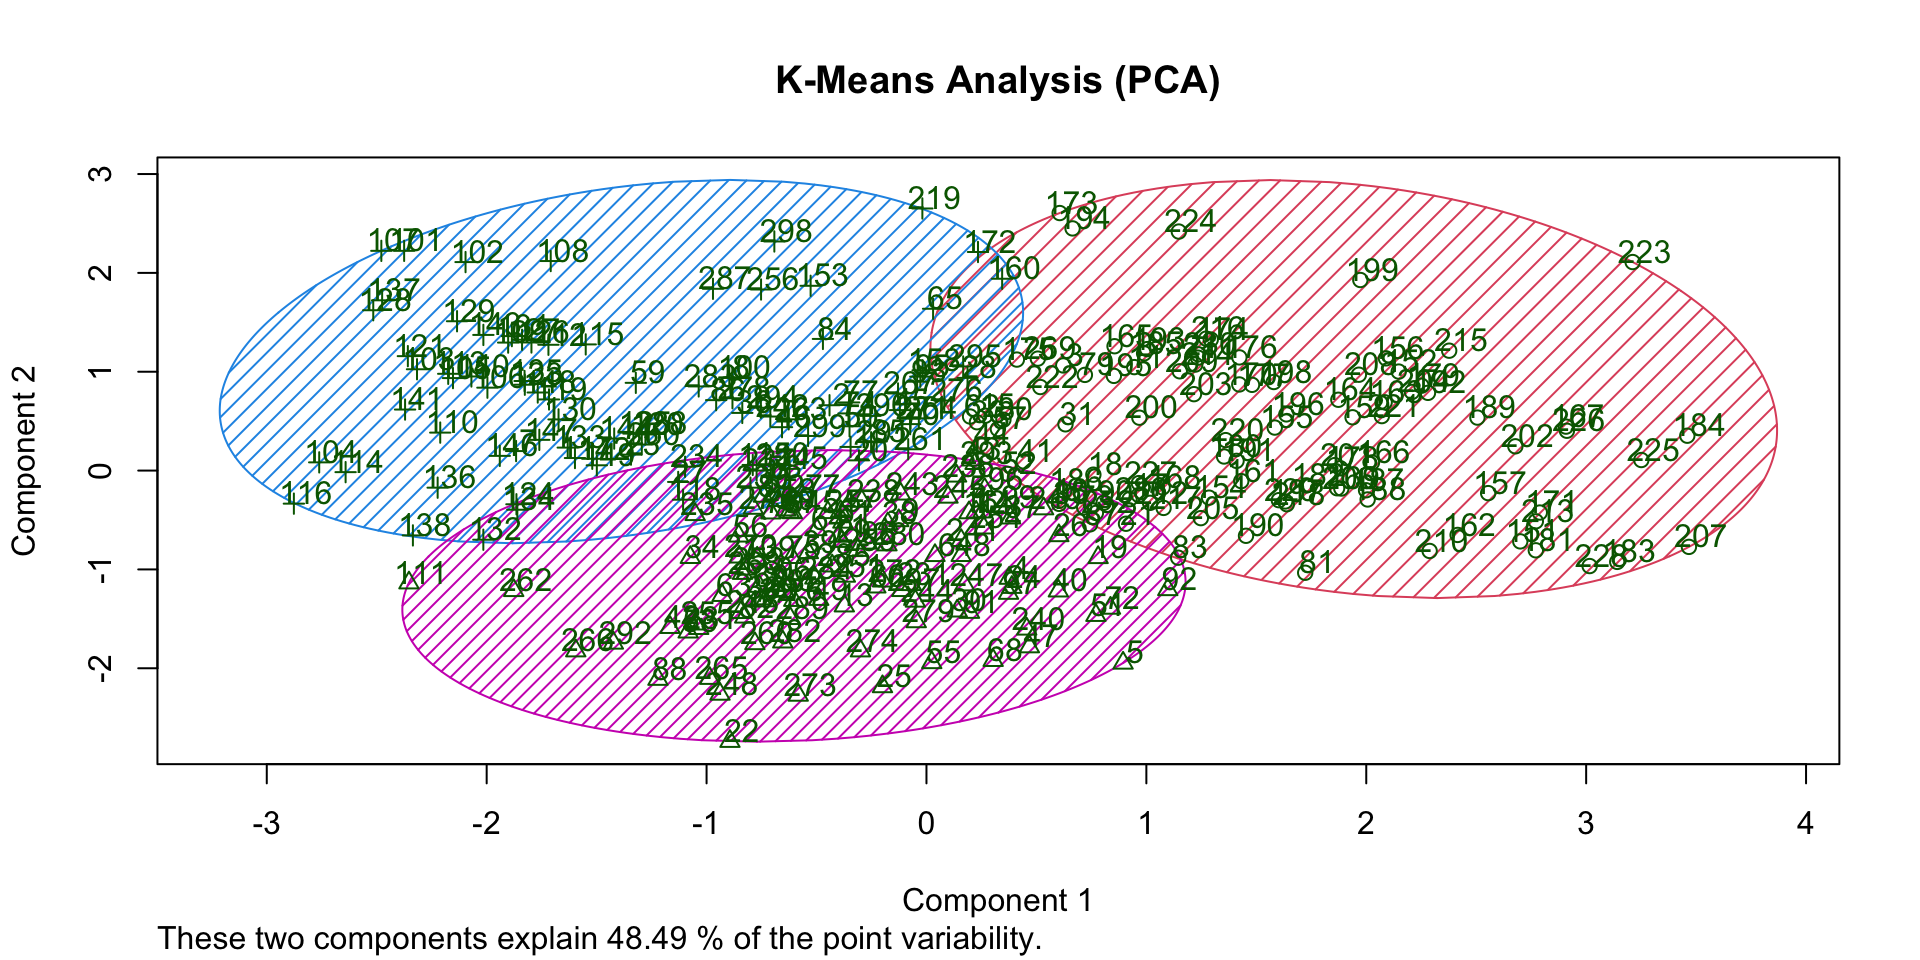
Overlap (K-Means)
FAMD
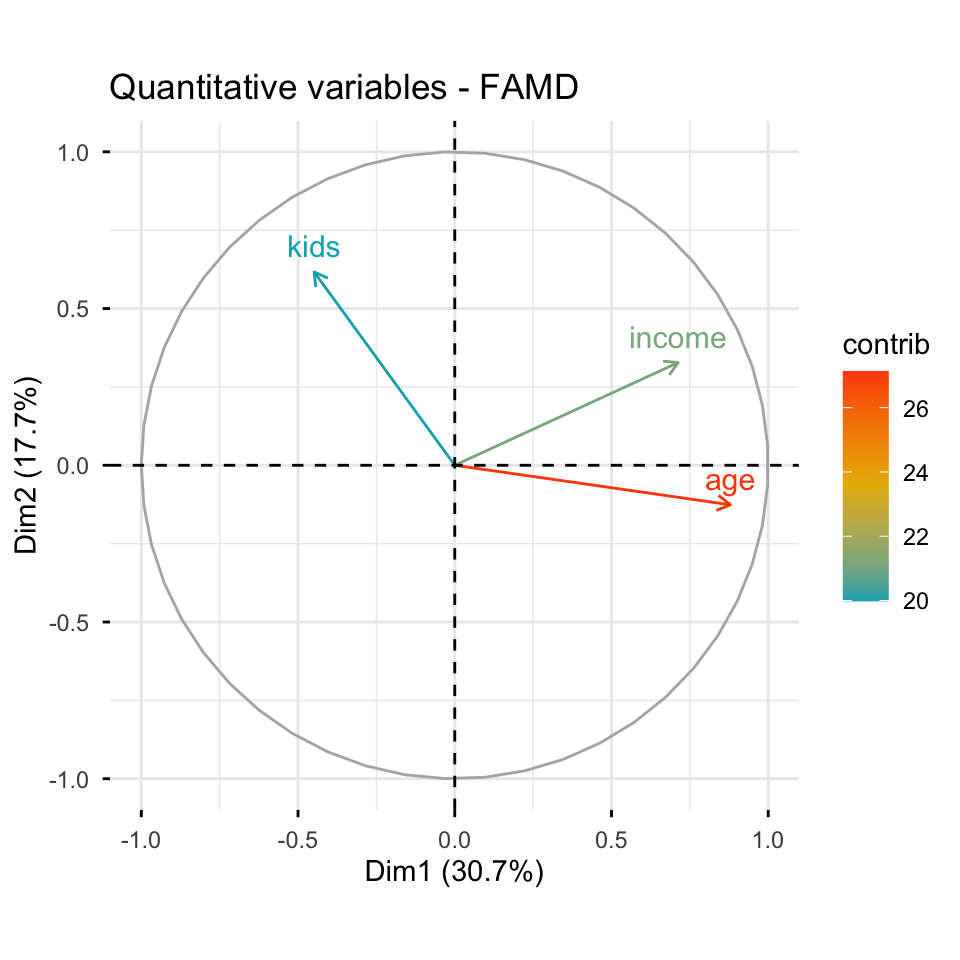
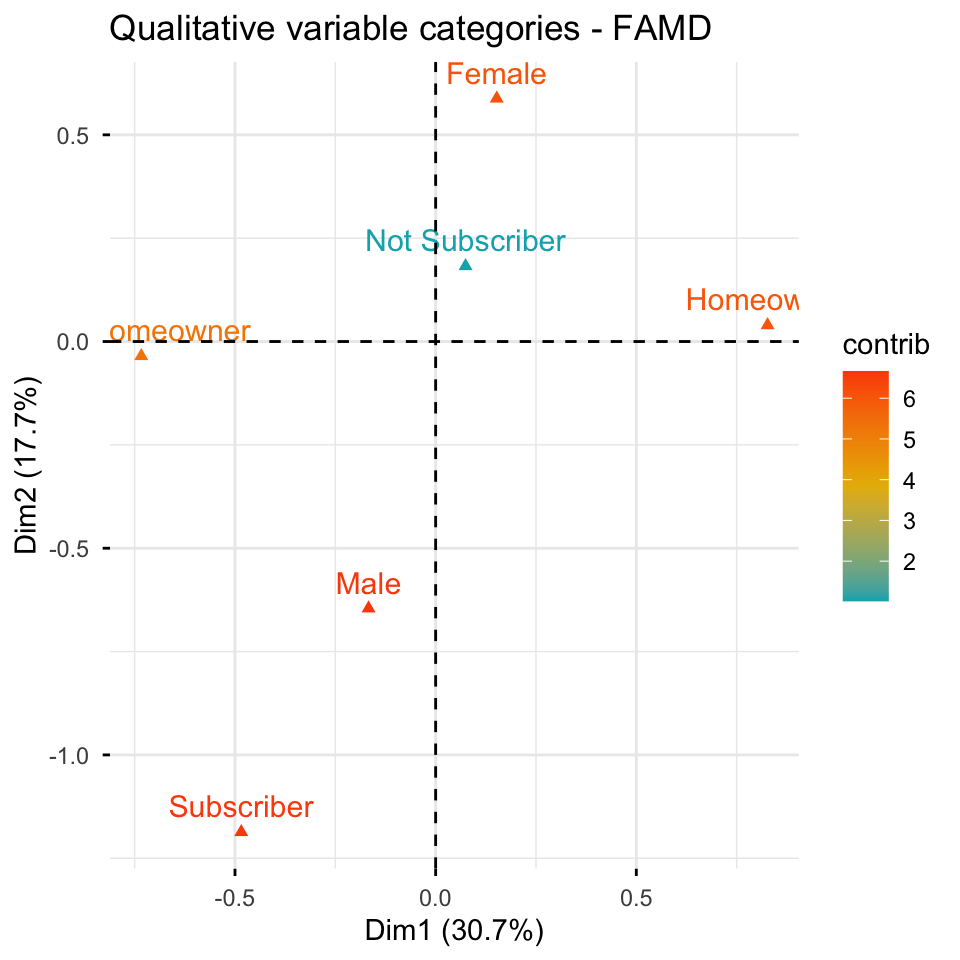
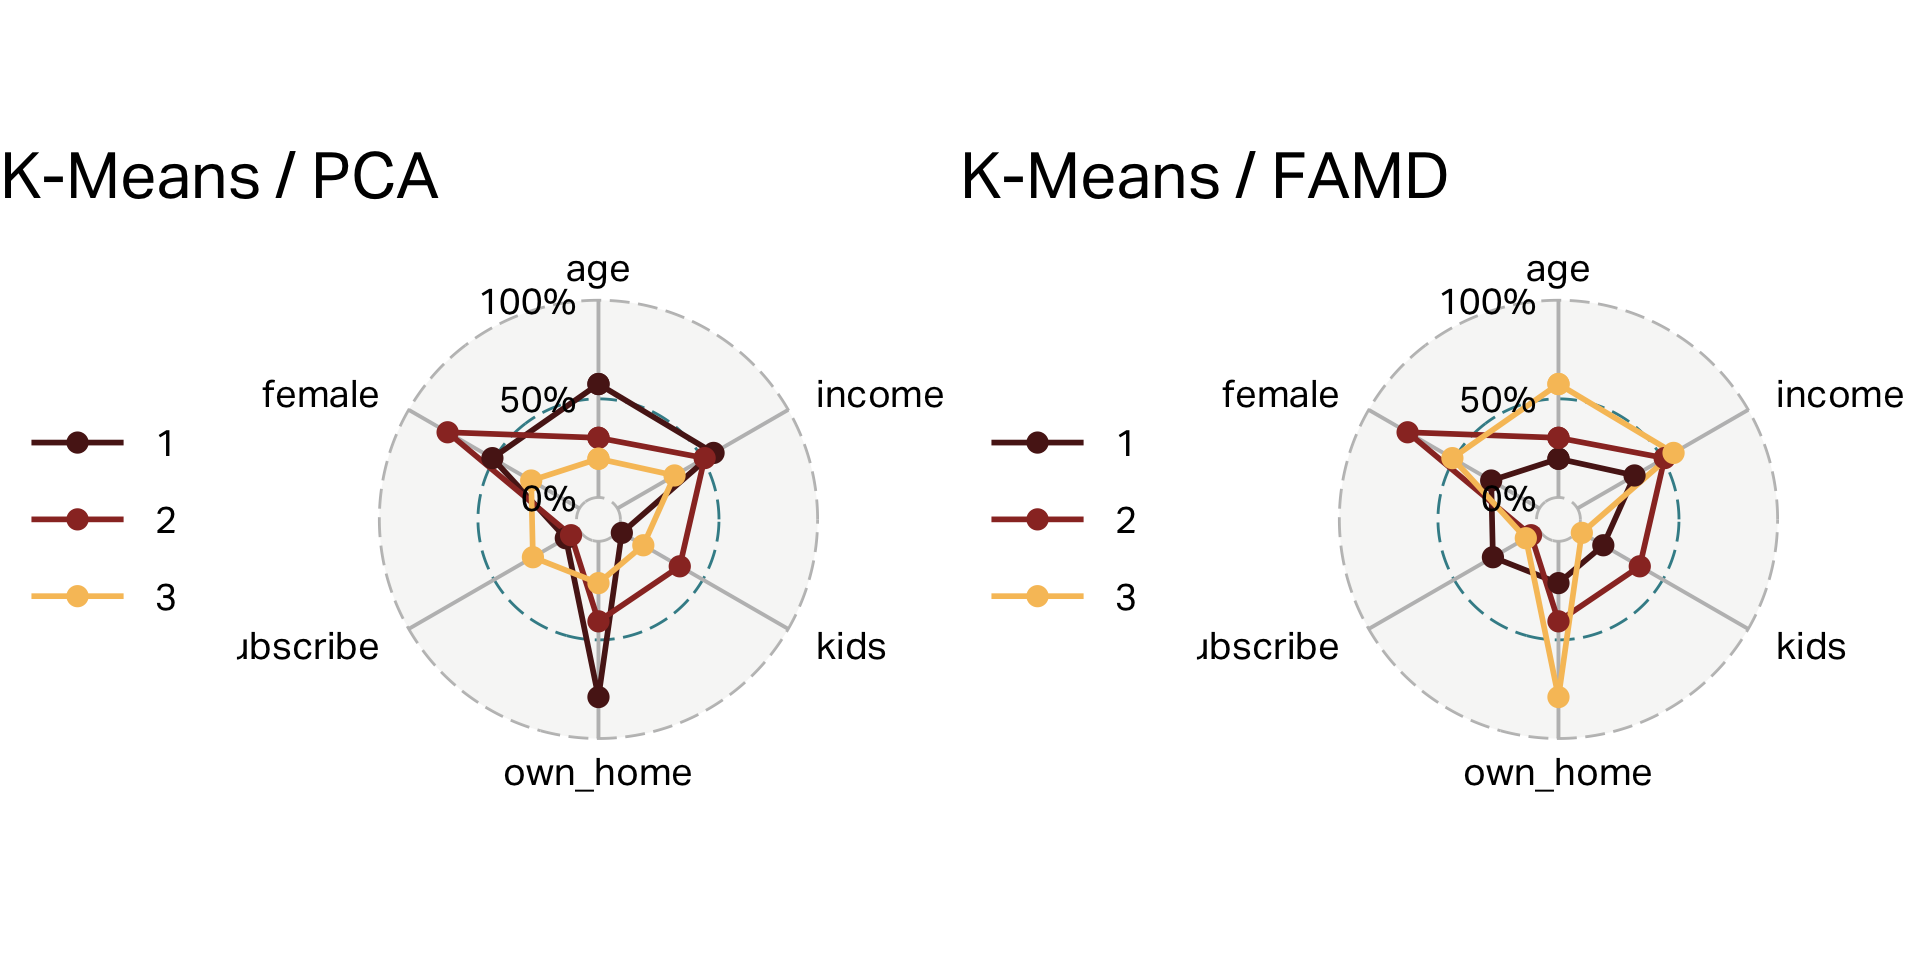
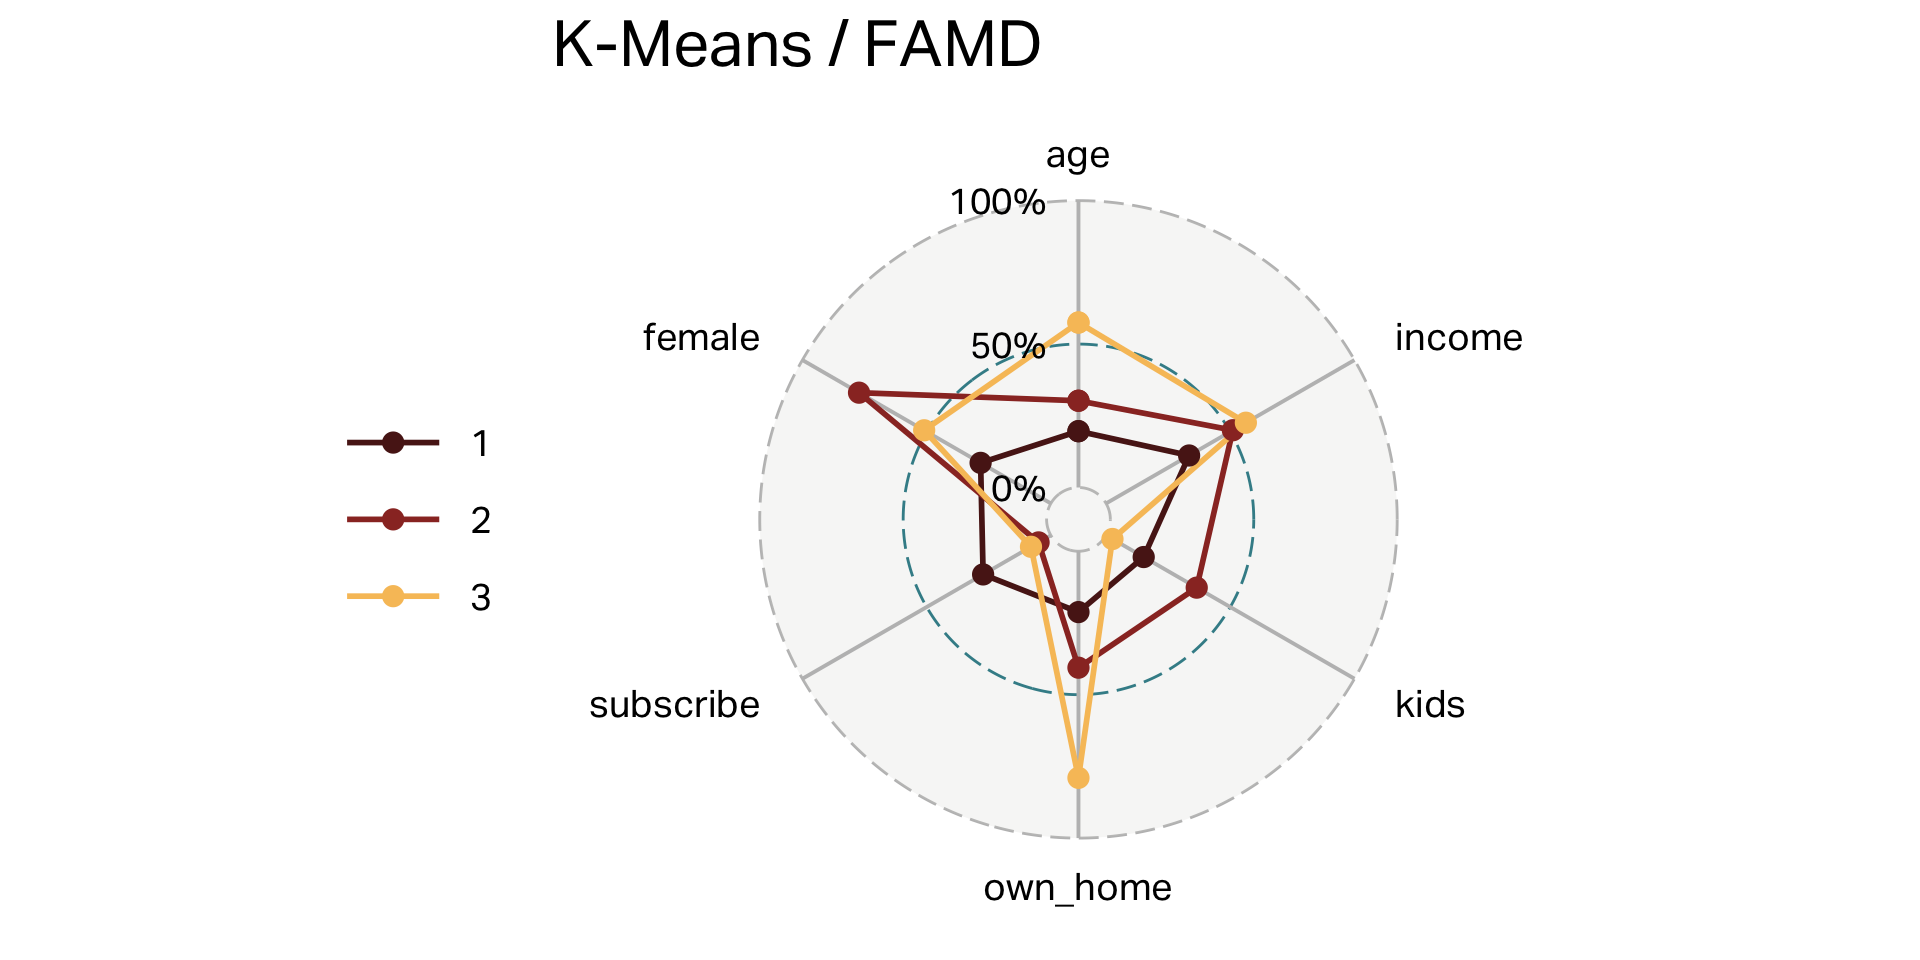
Three clusters (FAMD)
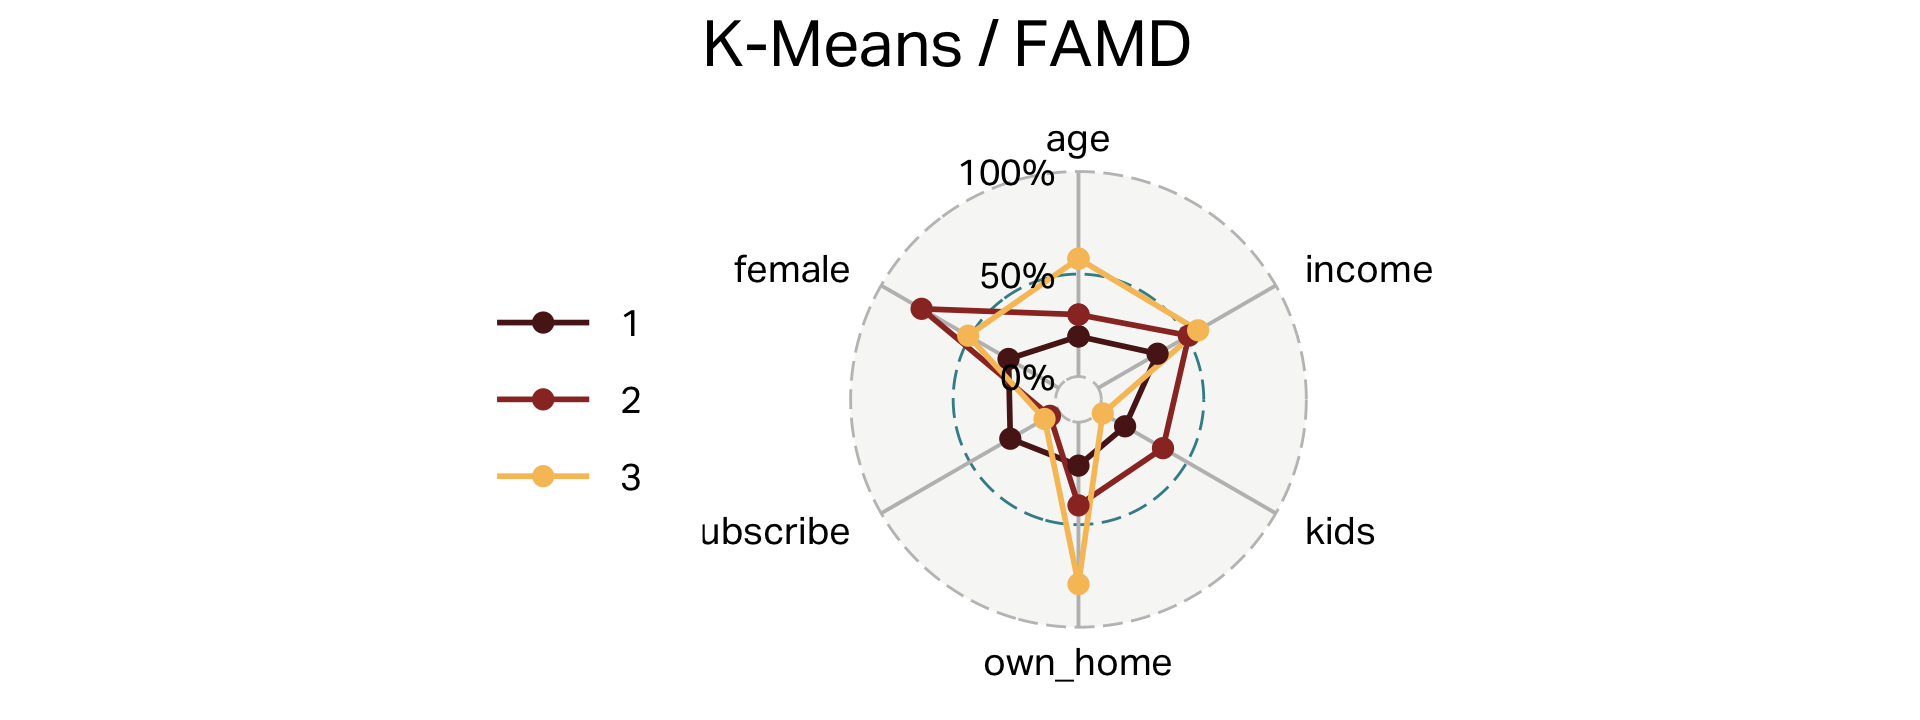
| cluster | n | age | income | kids | own_home | subscribe | female |
|---|---|---|---|---|---|---|---|
| 1 | 99 | 28 | 28,270 | 1 | 21% | 27% | 28% |
| 2 | 101 | 38 | 56,016 | 3 | 41% | 5% | 77% |
| 3 | 100 | 55 | 60,107 | 0 | 79% | 8% | 51% |
Overlap (FAMD)
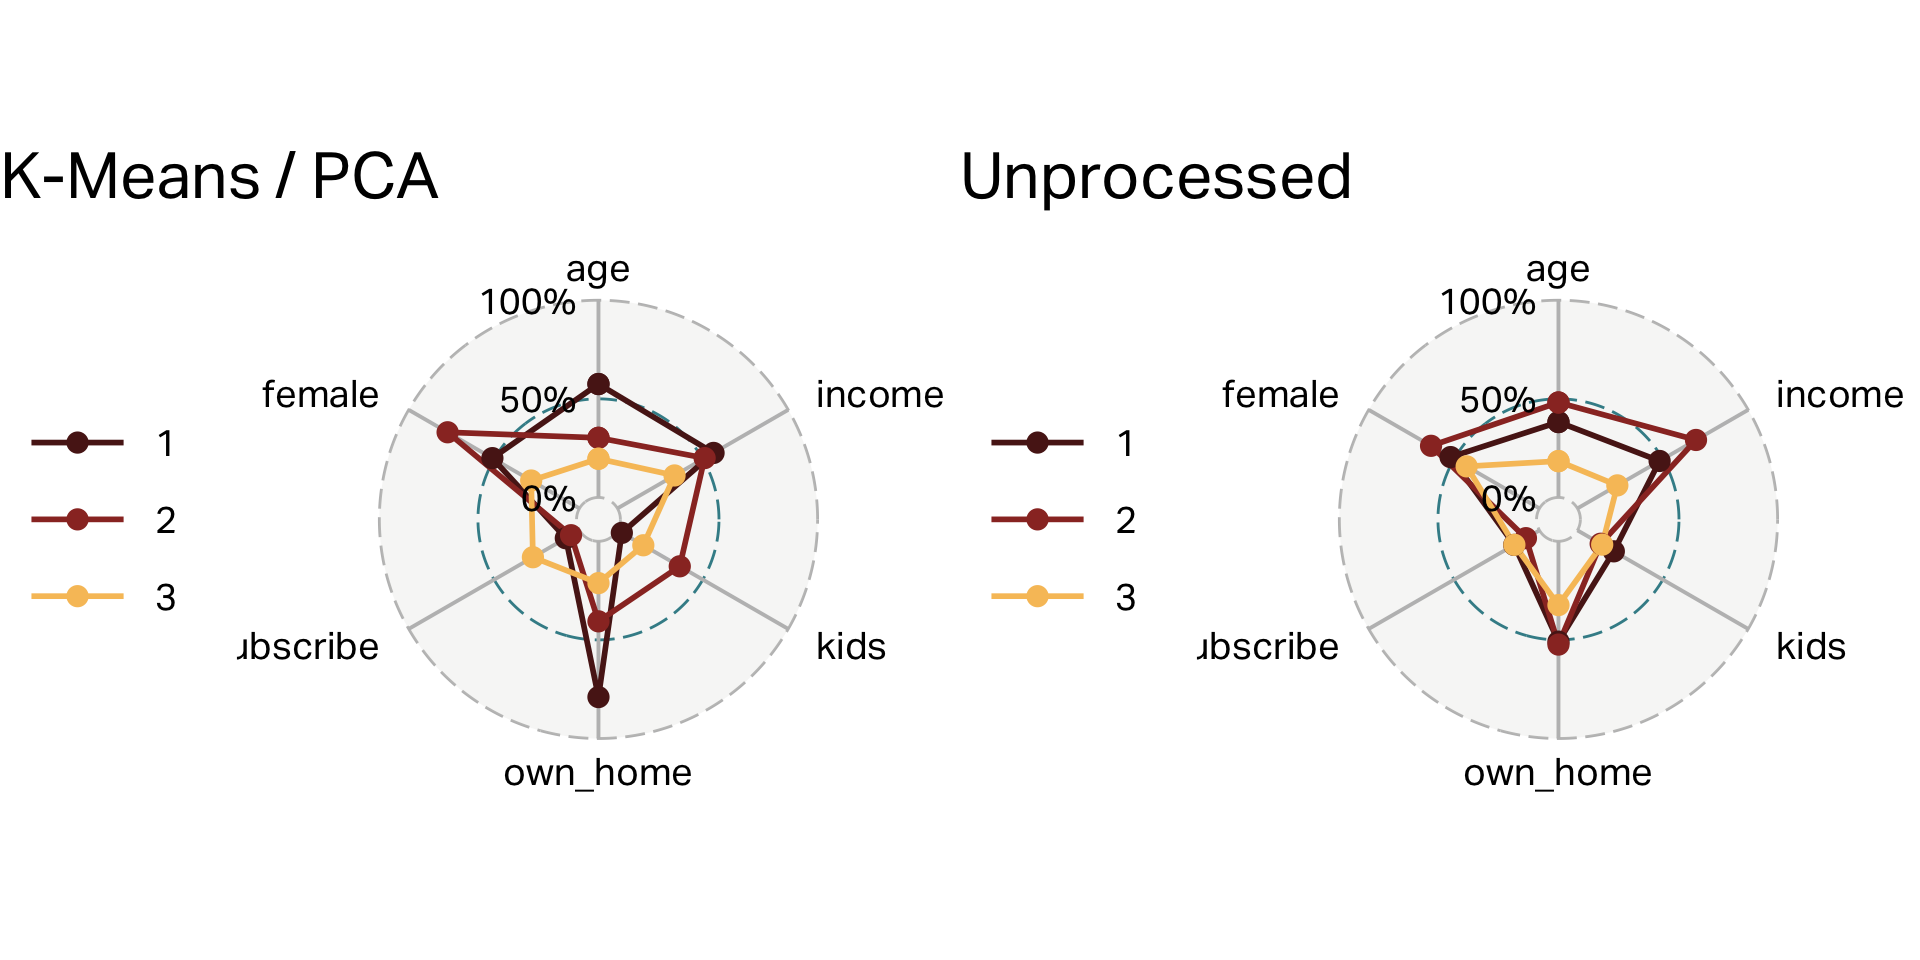
Comparison
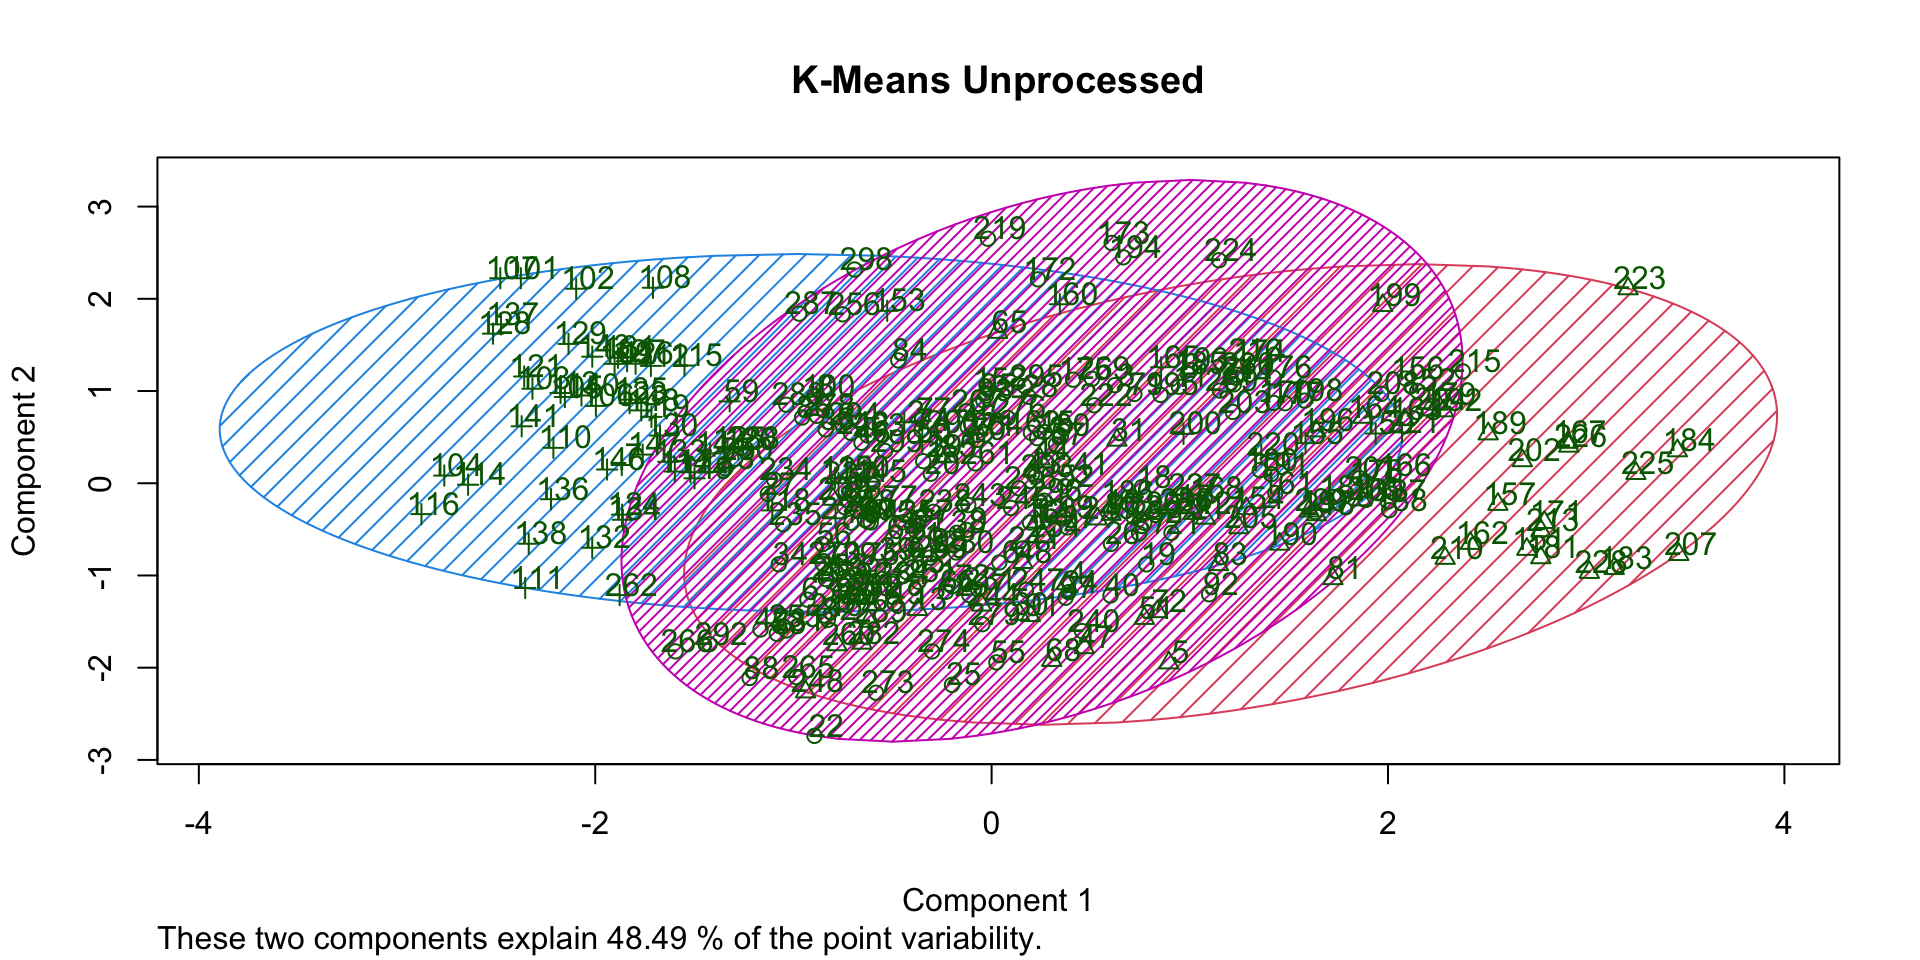
K-Means with no pre-processing
Overlap (no processing)
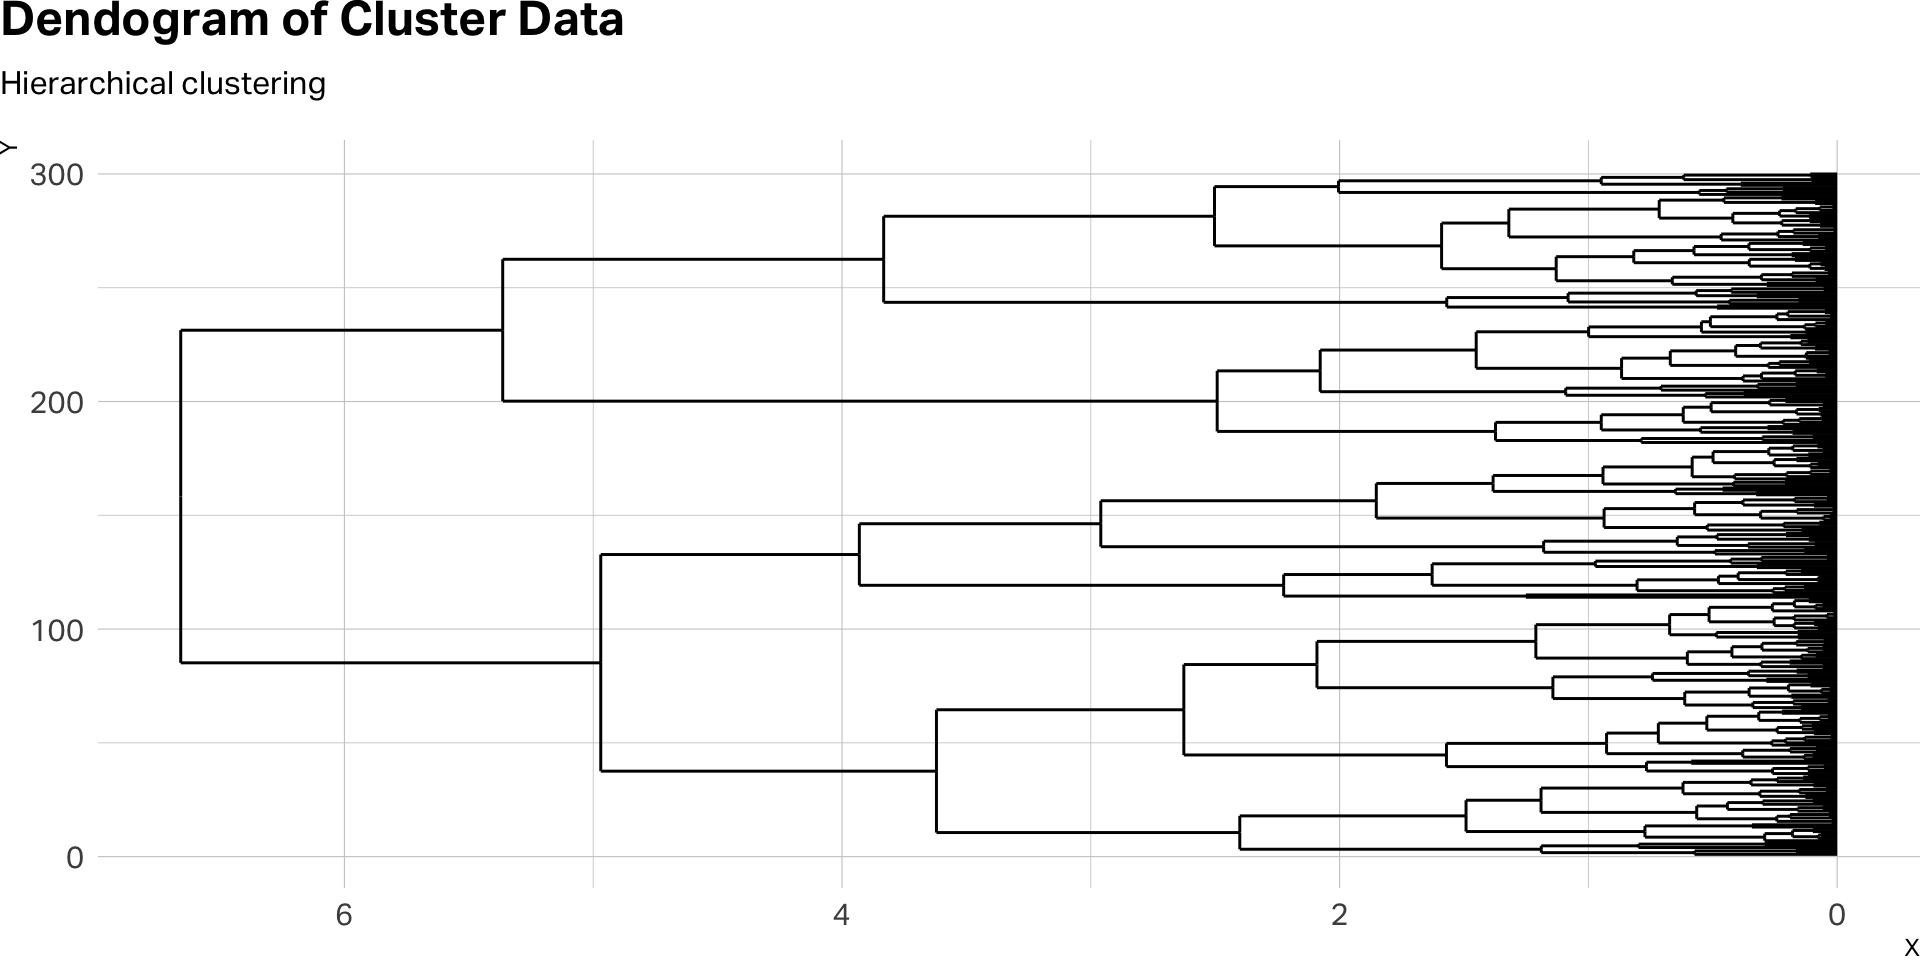
Dendograms
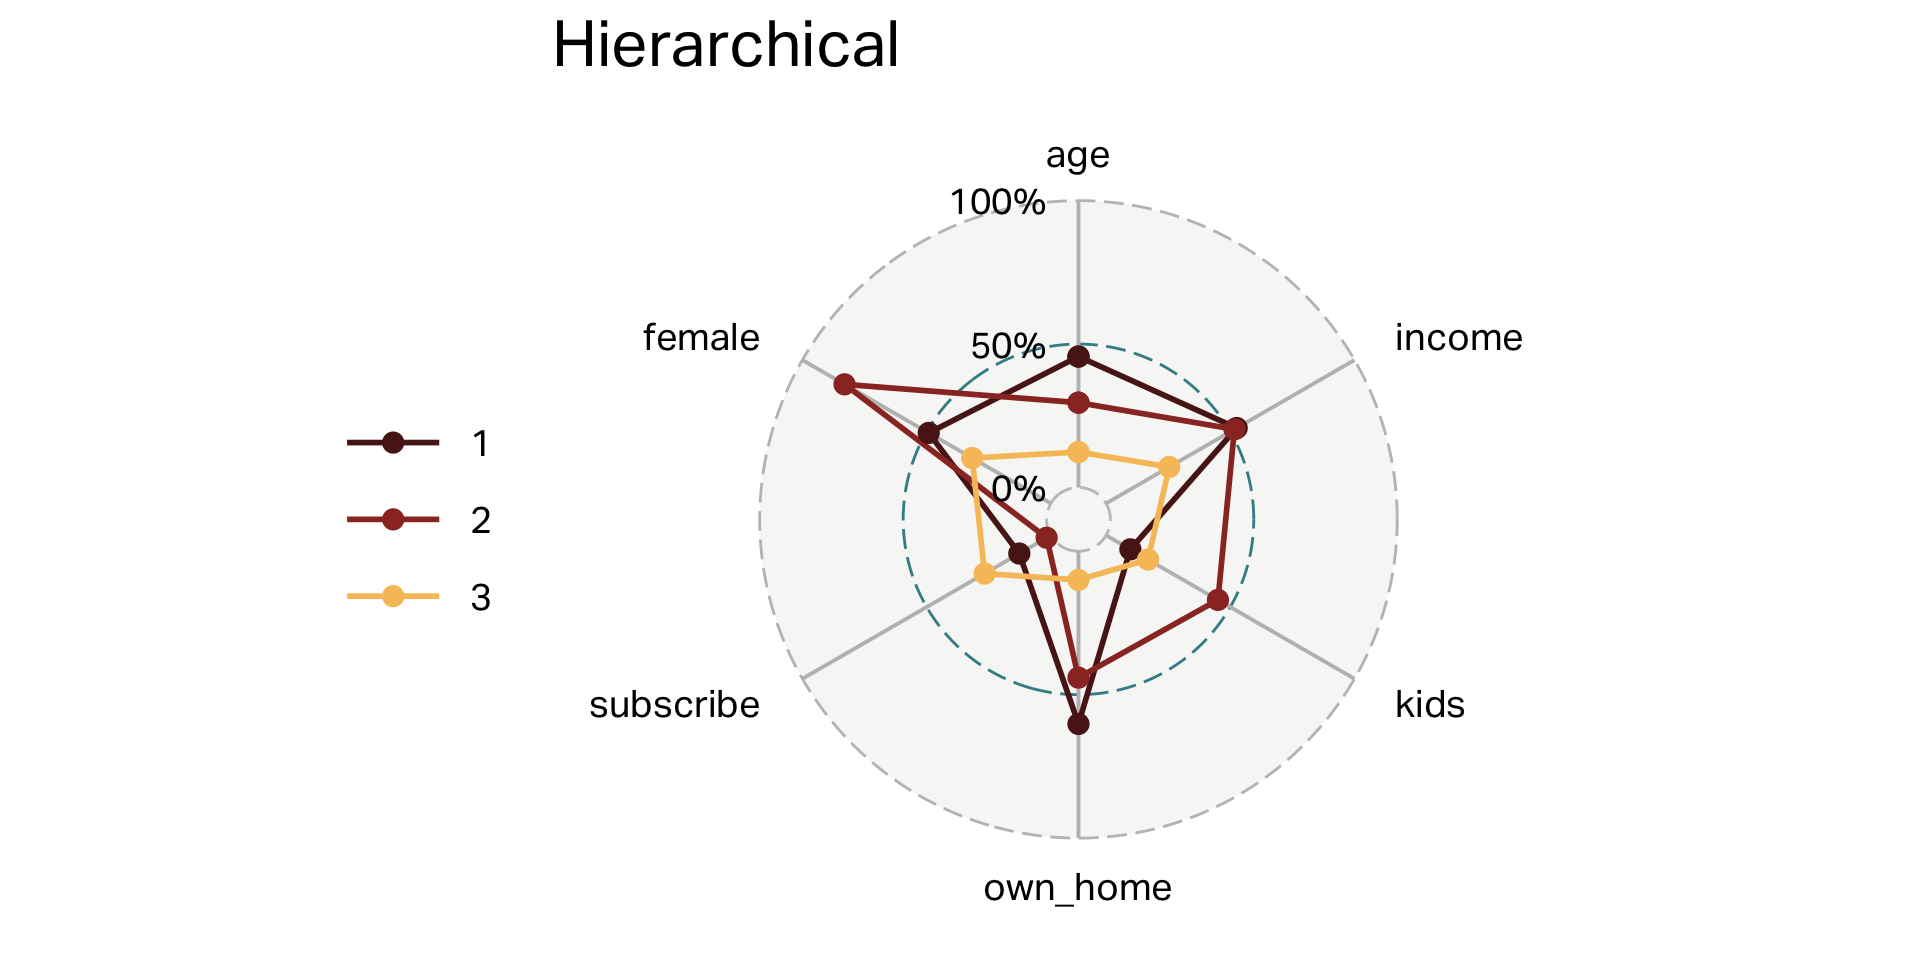
Clusters (HC)
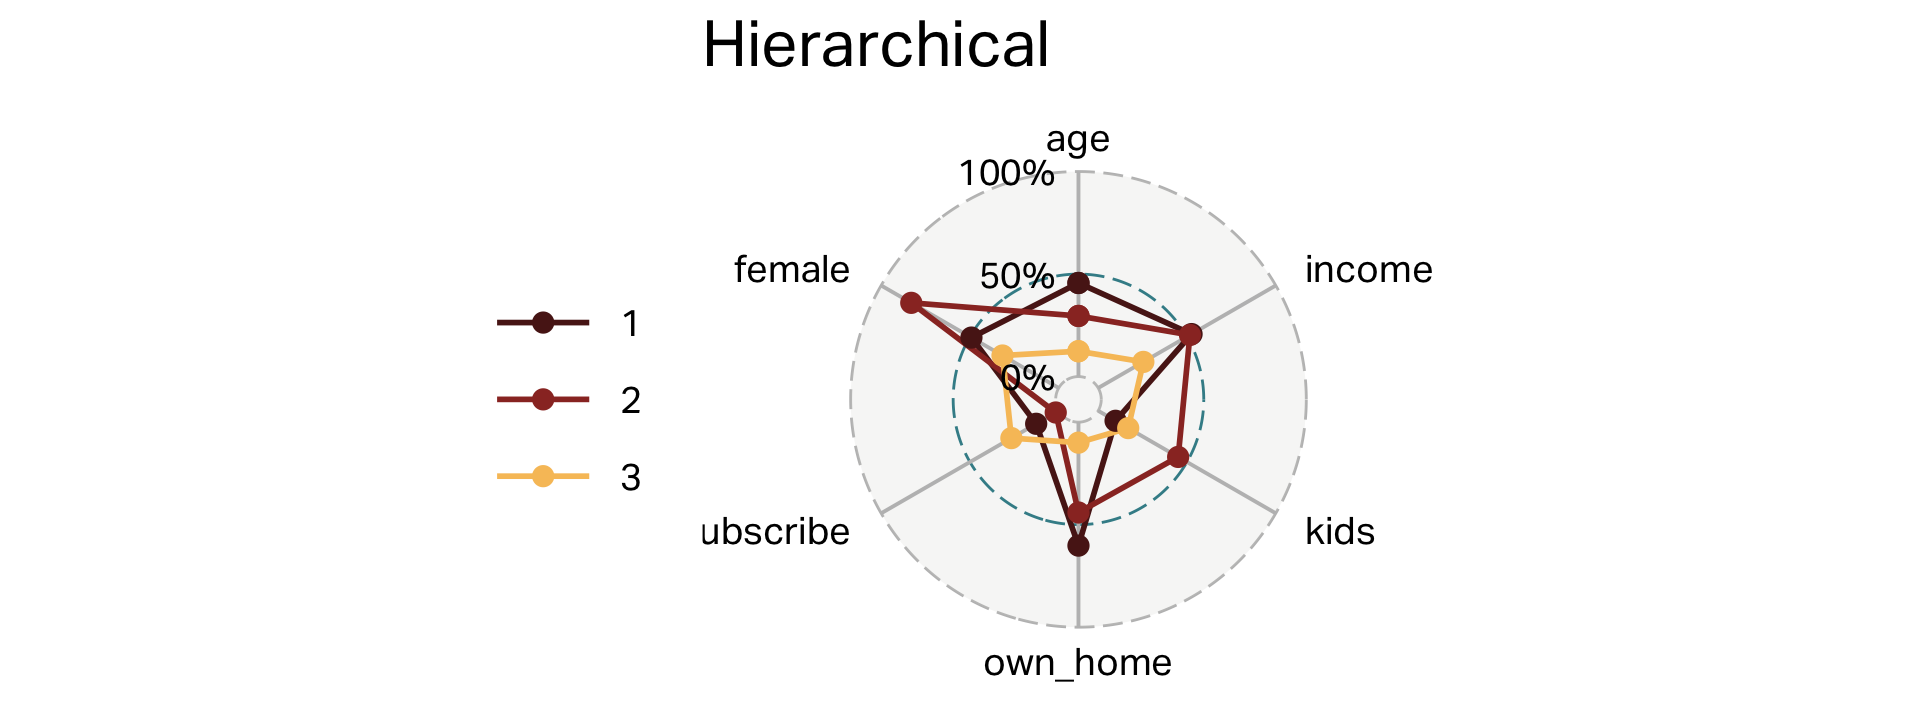
| segment | n | age | income | kids | own_home | subscribe | female |
|---|---|---|---|---|---|---|---|
| 1 | 181 | 45 | 57,037 | 0 | 60% | 13% | 49% |
| 2 | 59 | 38 | 54,509 | 3 | 44% | 2% | 83% |
| 3 | 60 | 25 | 23,116 | 1 | 10% | 27% | 32% |
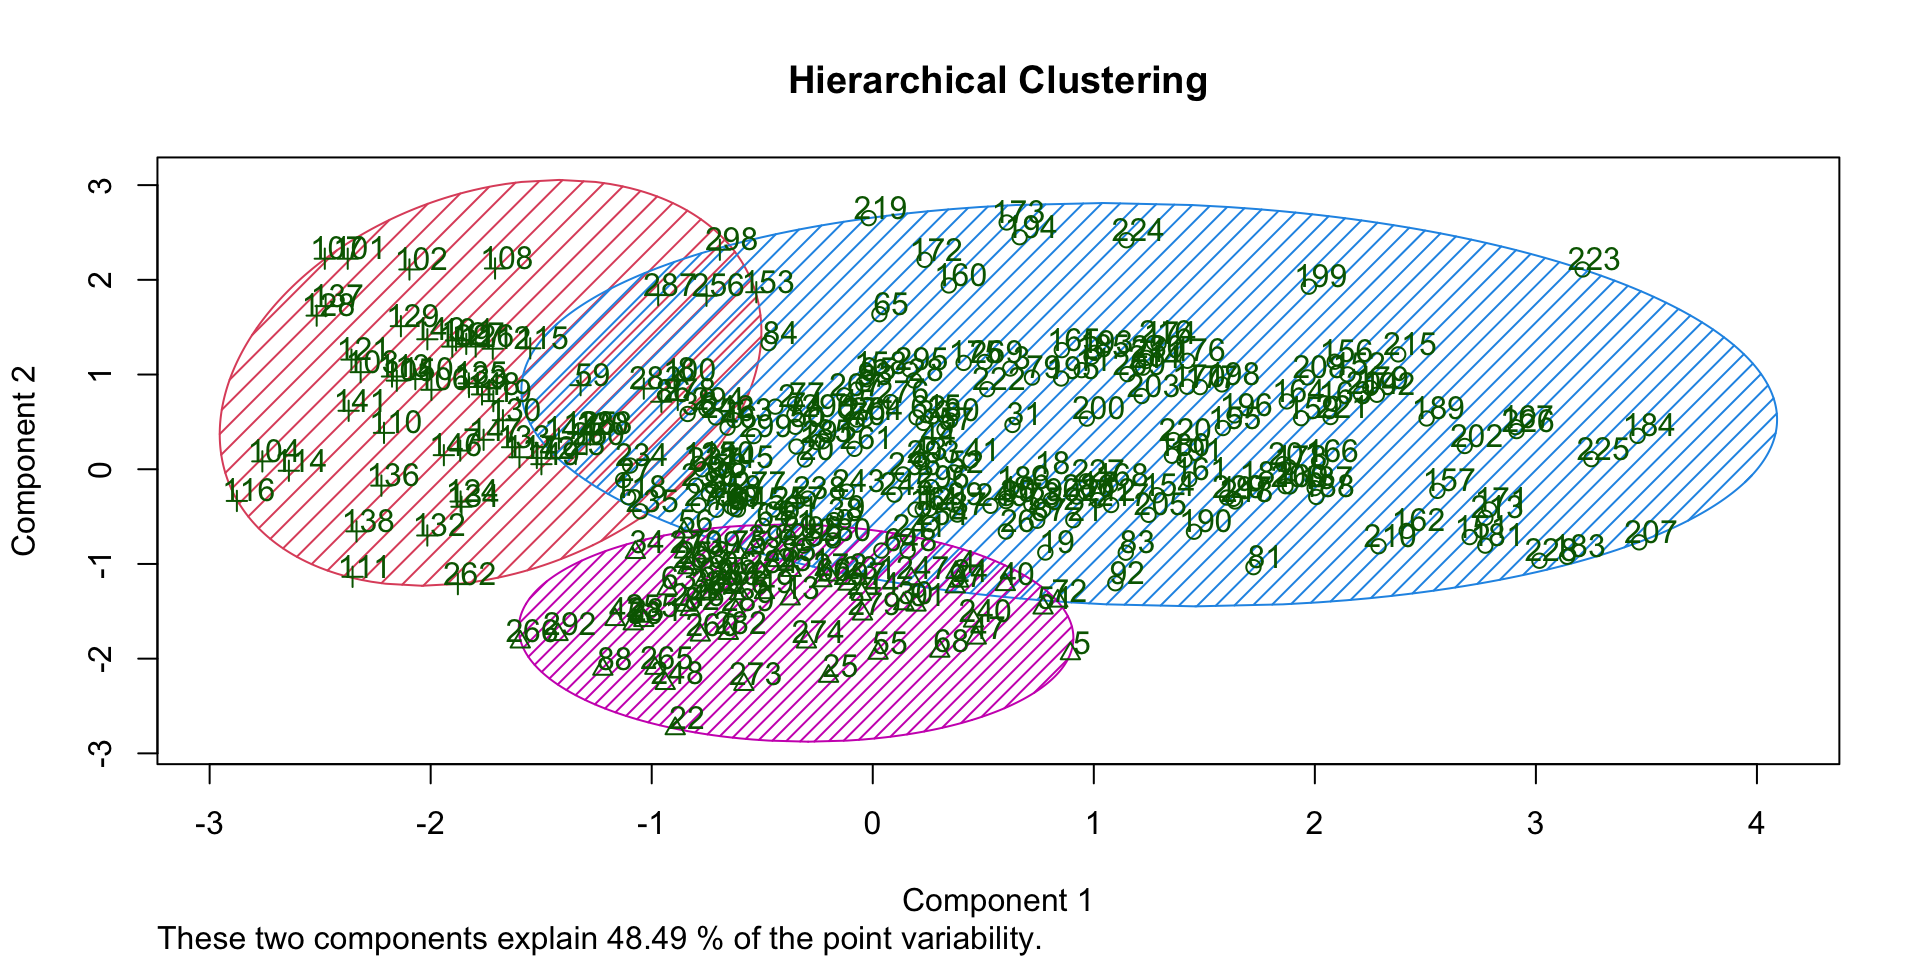
Overlap (HC)
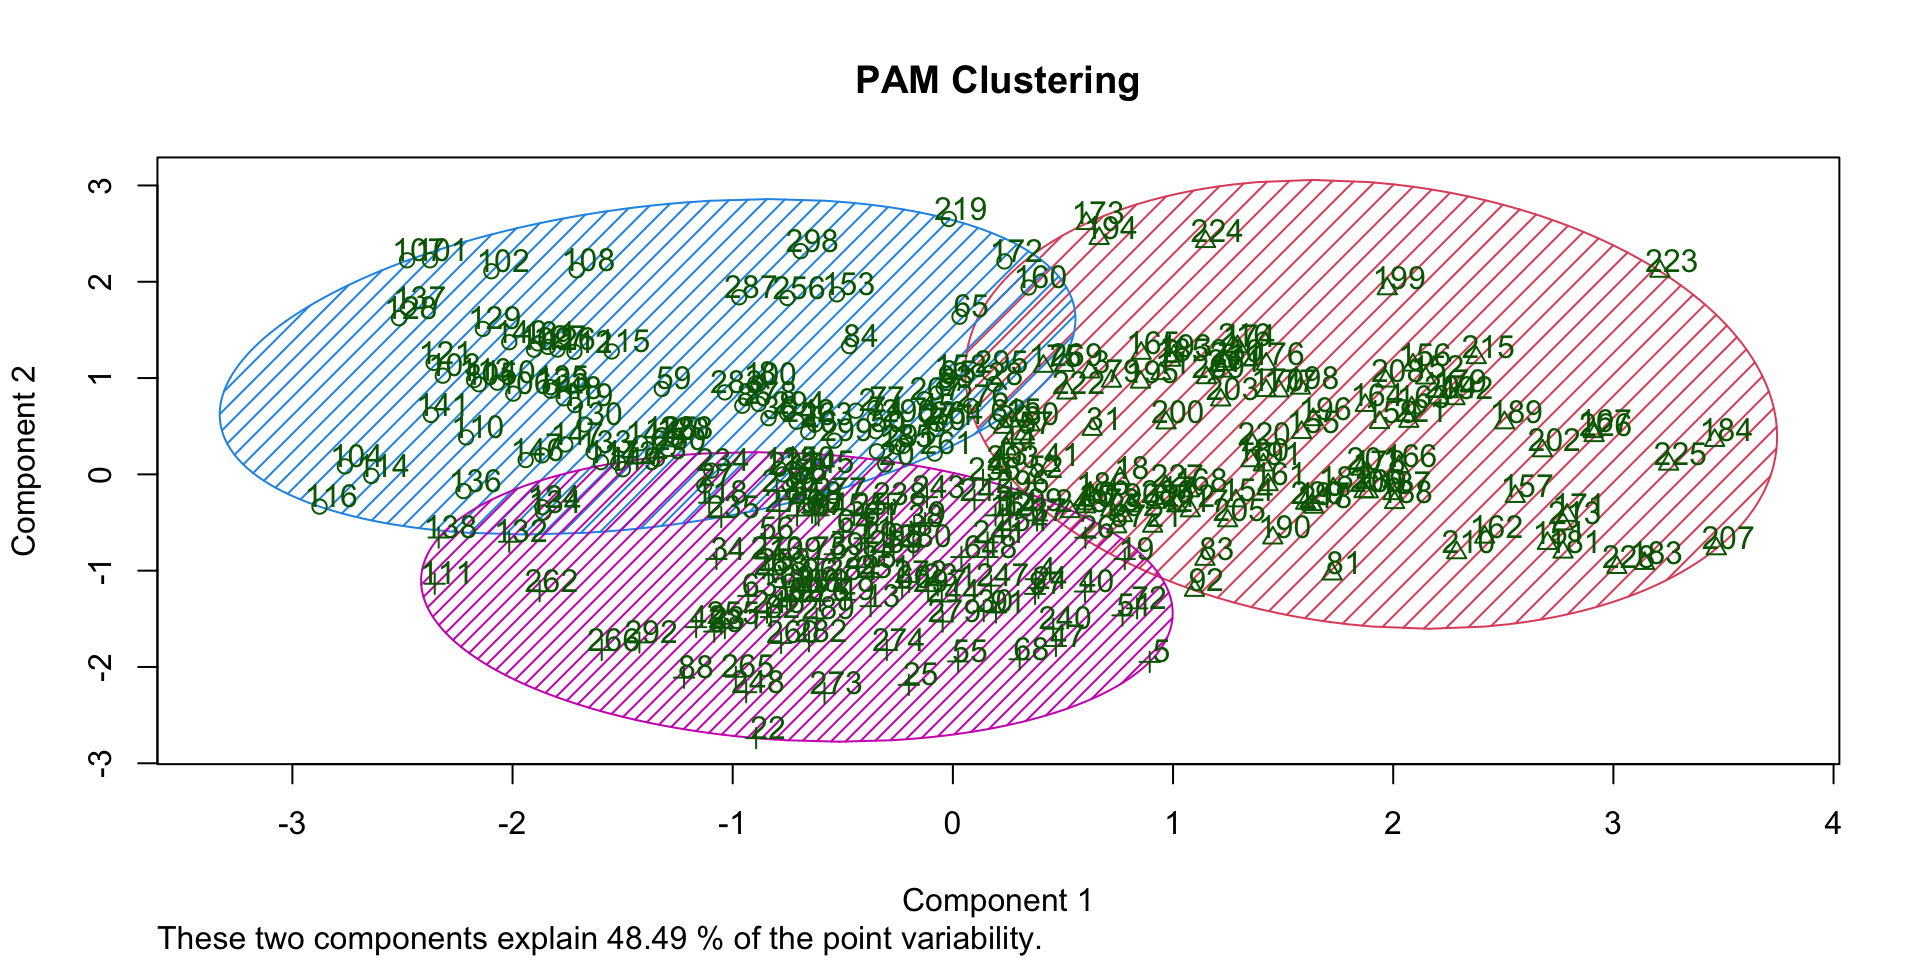
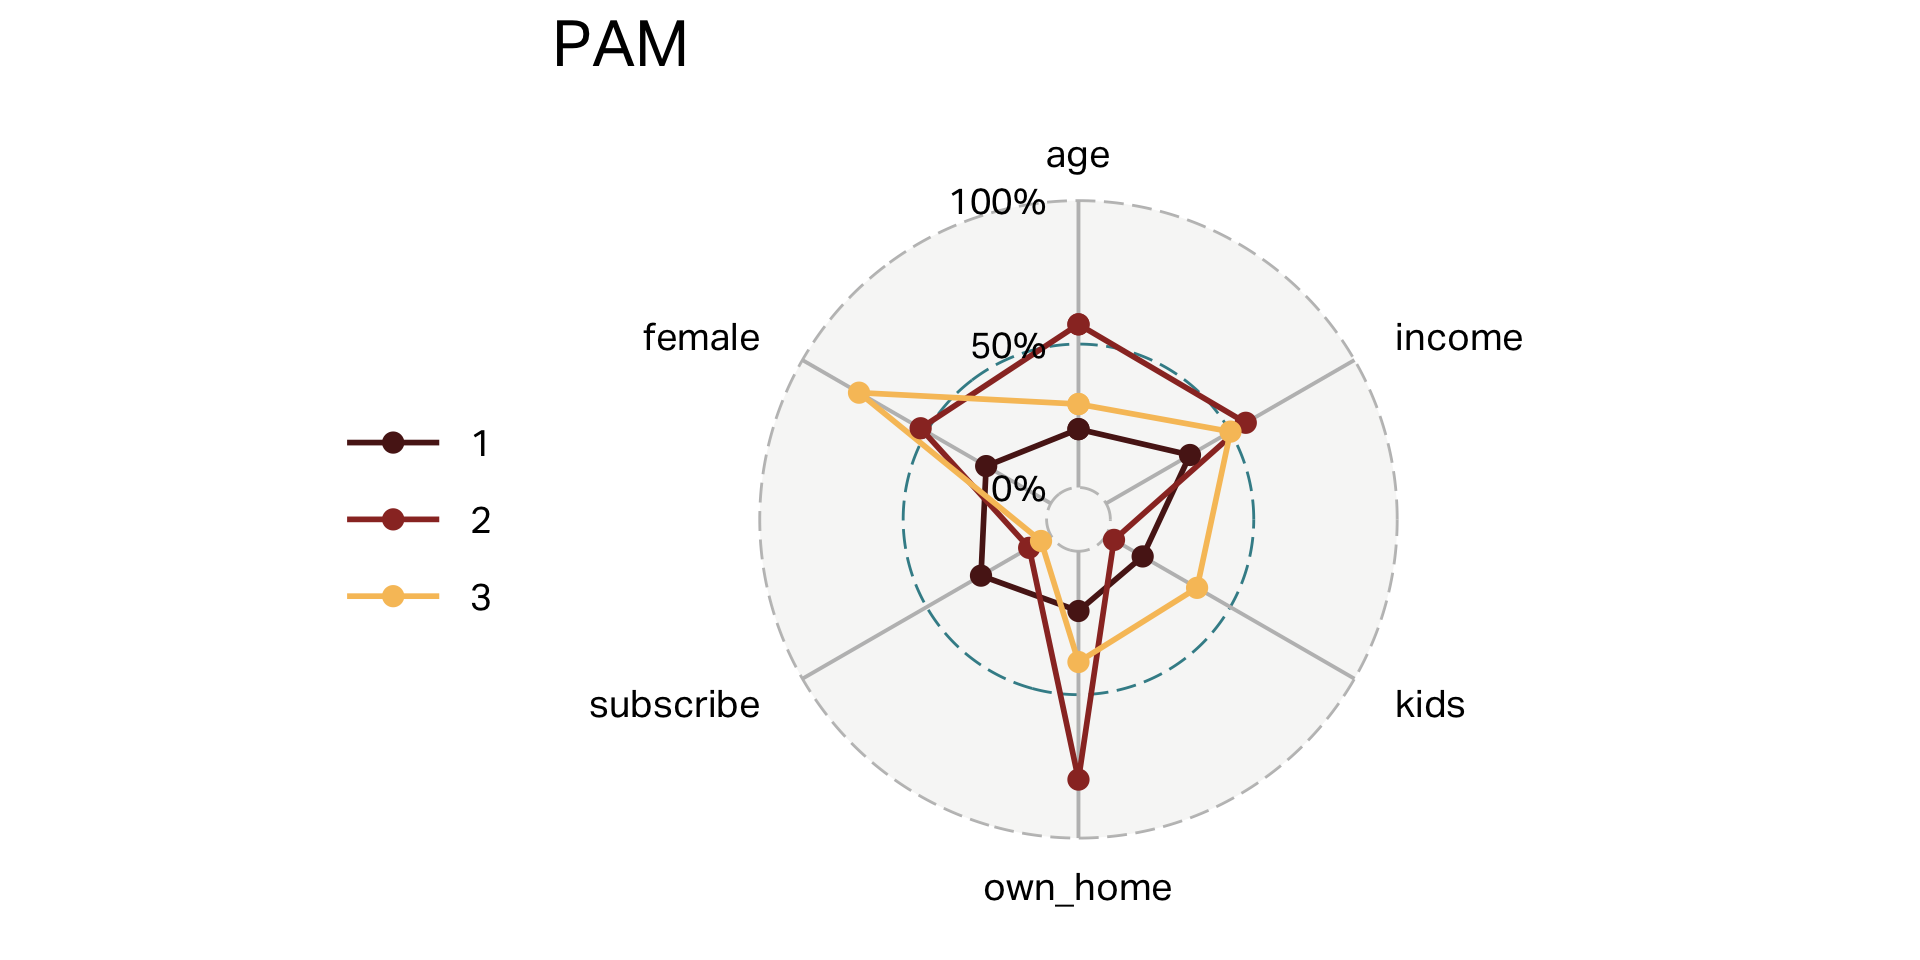
Clusters (PAM)
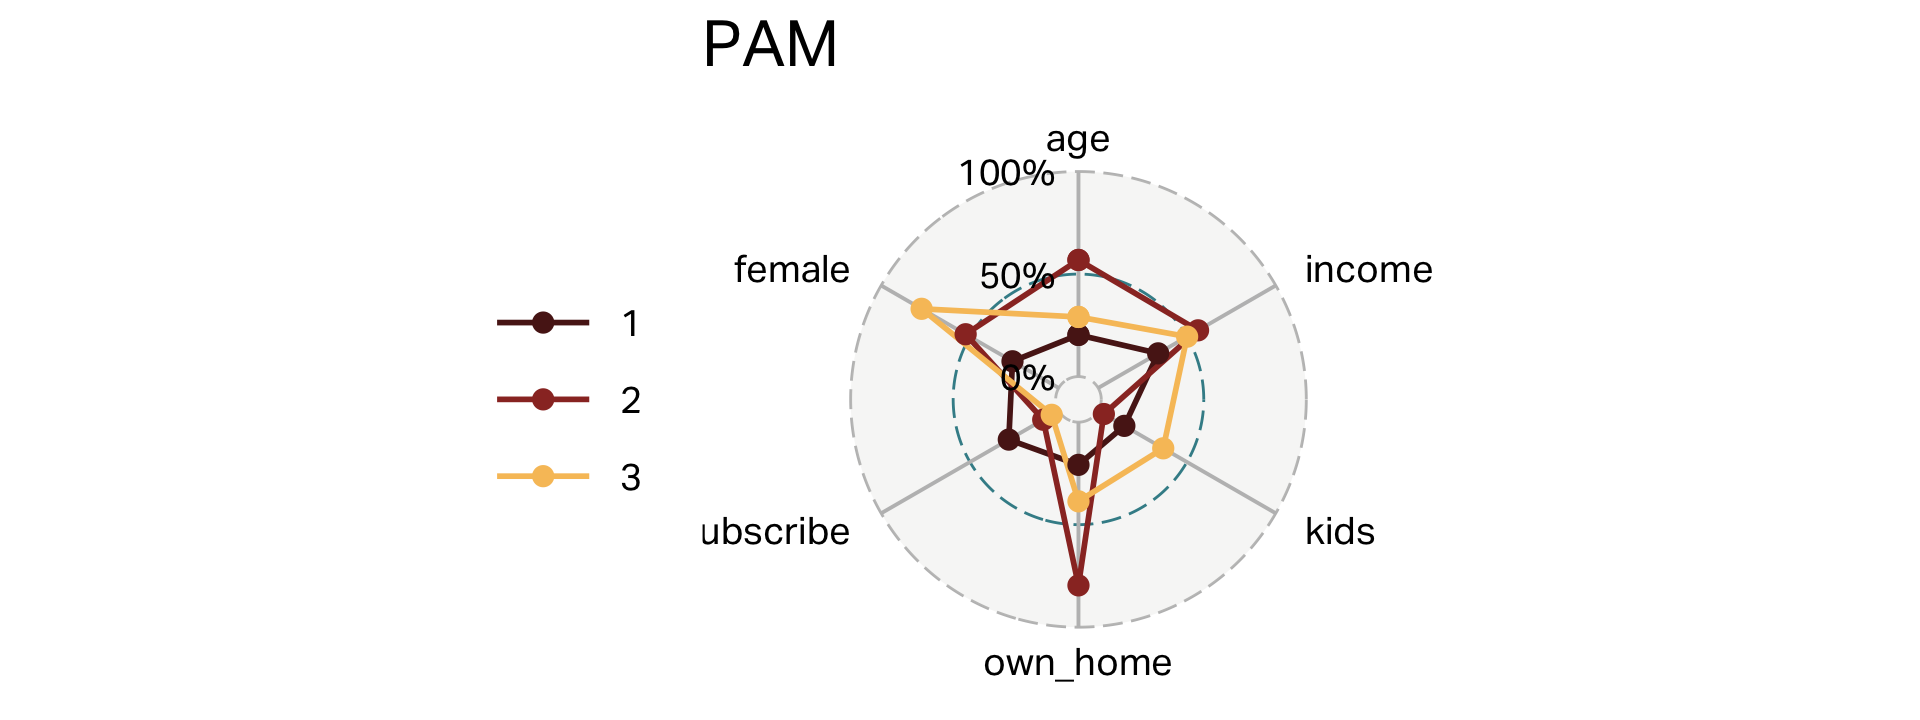
| segment | n | age | income | kids | own_home | subscribe | female |
|---|---|---|---|---|---|---|---|
| 1 | 96 | 31 | 28,793 | 1 | 21% | 28% | 26% |
| 2 | 103 | 54 | 60,168 | 0 | 80% | 9% | 52% |
| 3 | 101 | 38 | 55,847 | 3 | 39% | 4% | 77% |
Overlap (PAM)
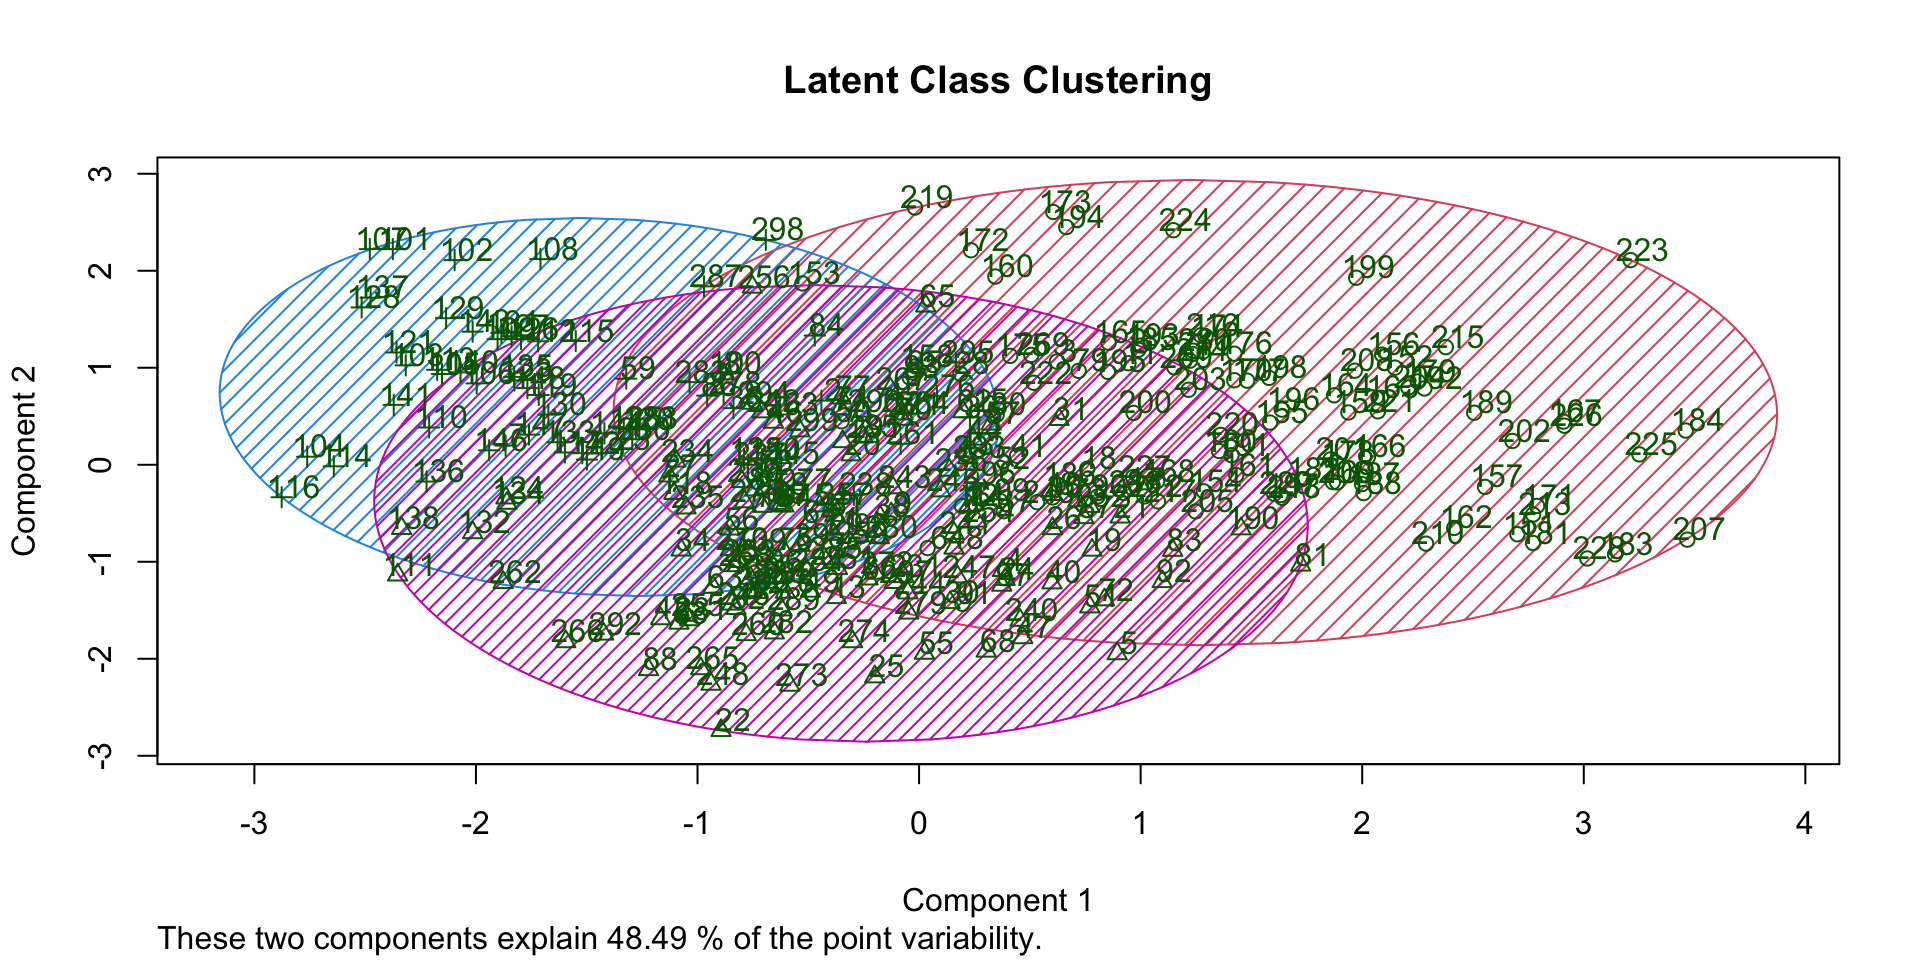
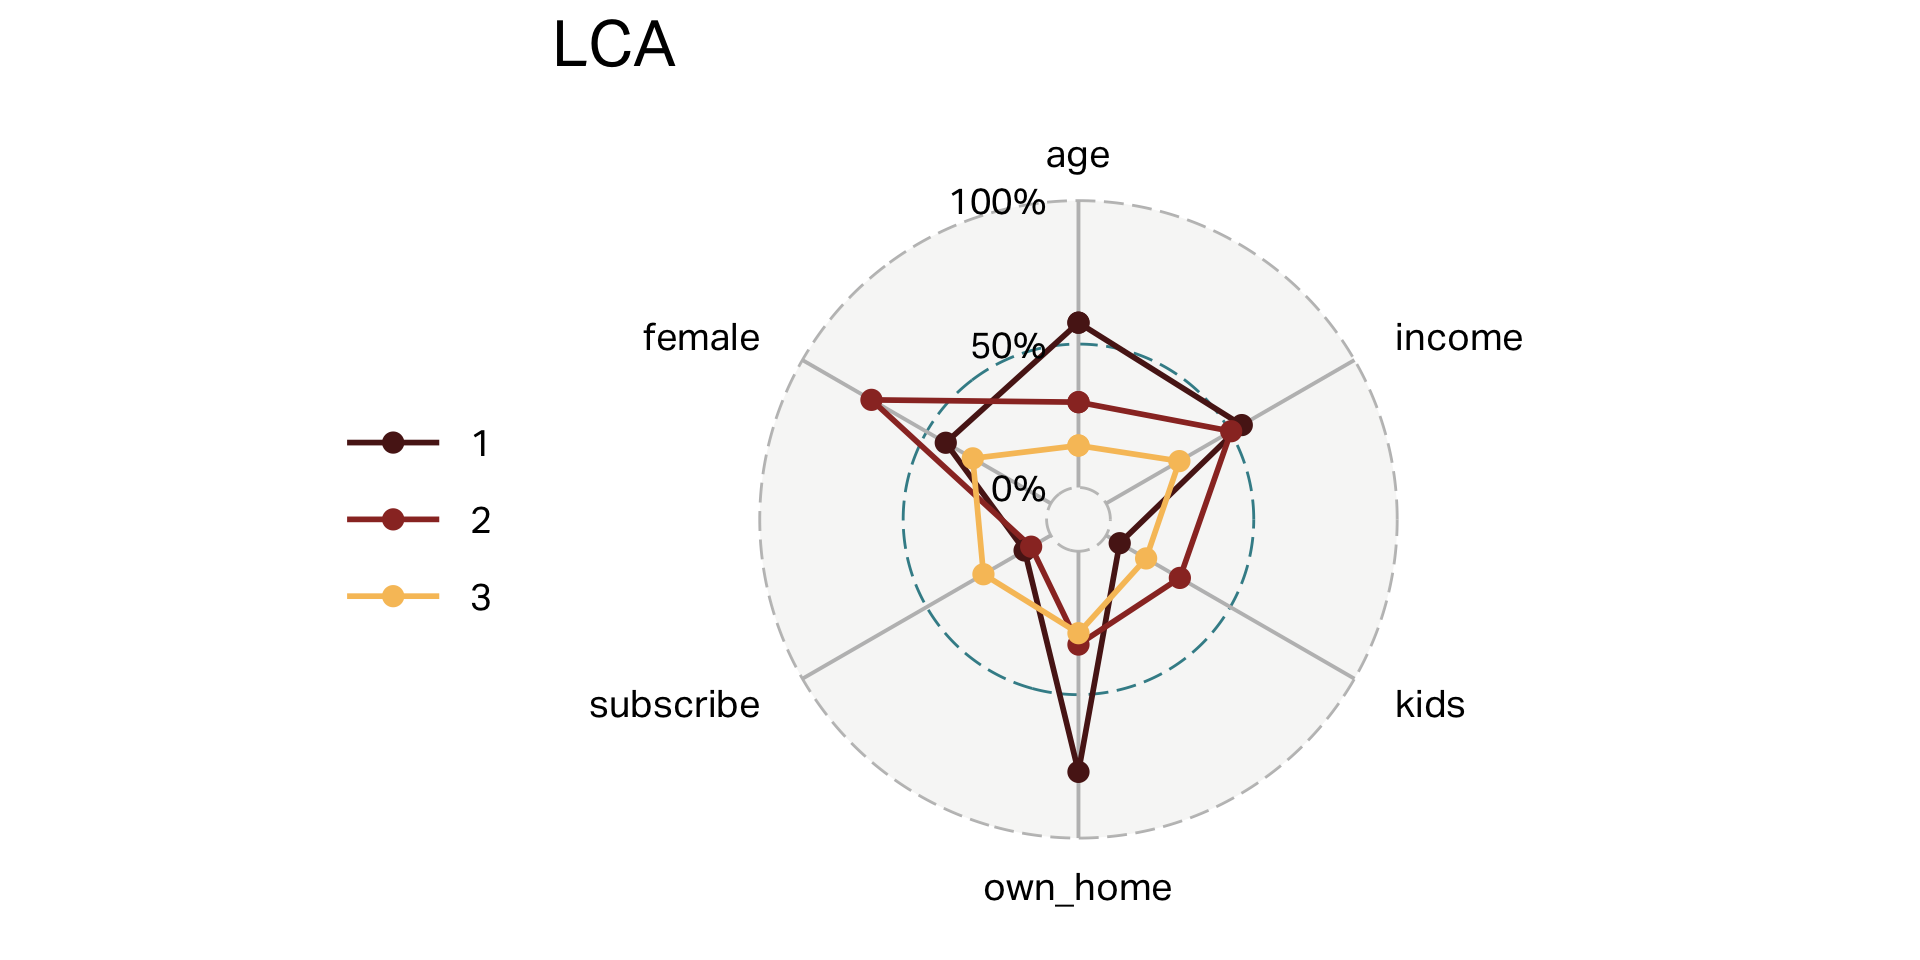
Clusters (LCA)
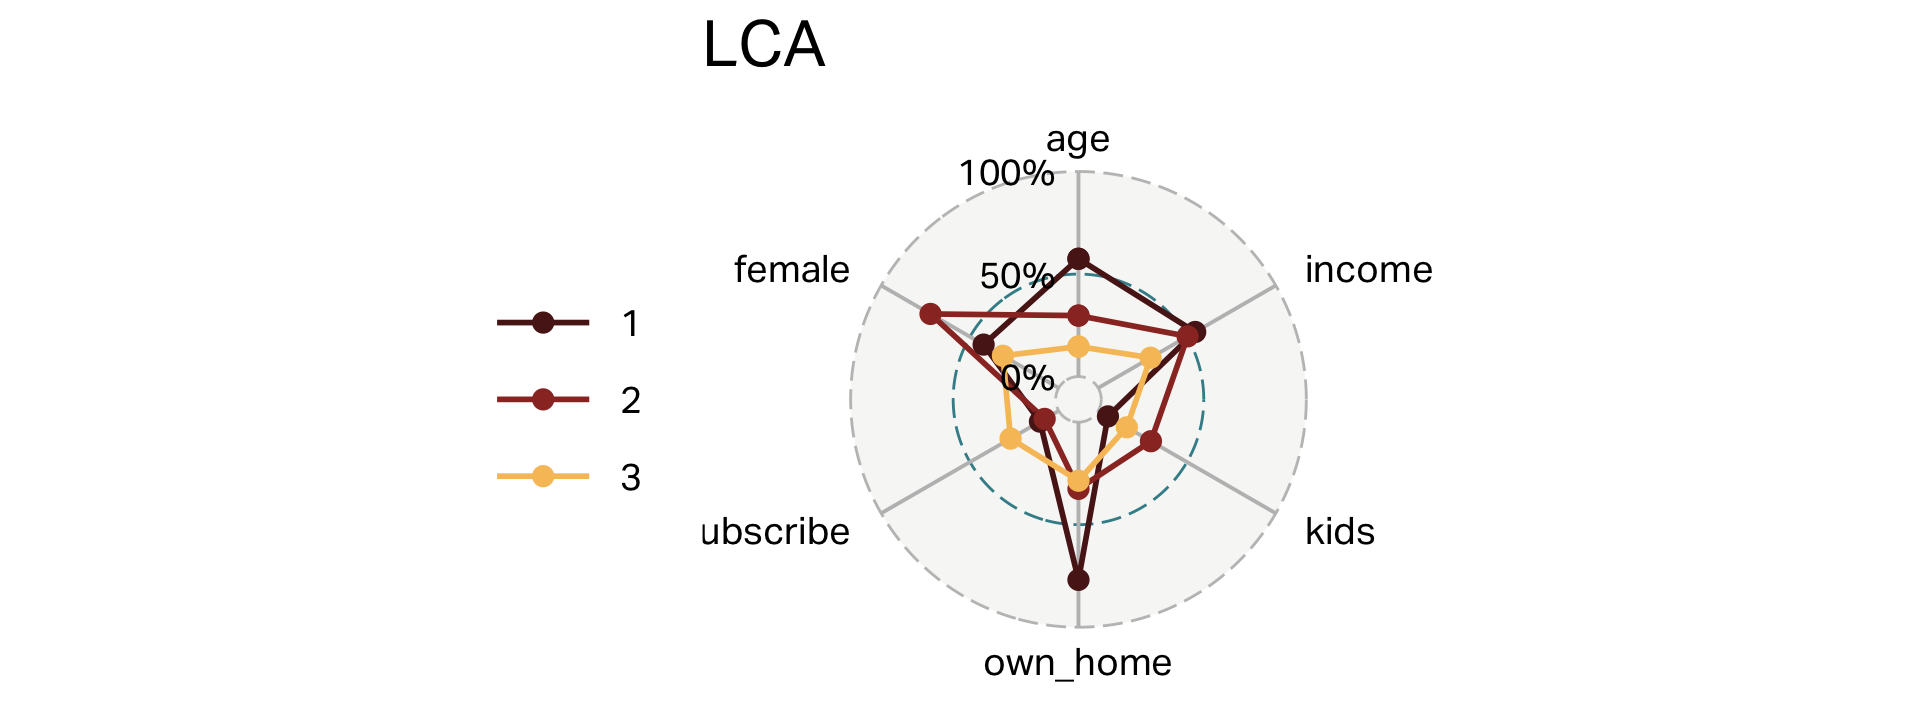
| segment | n | age | income | kids | own_home | subscribe | female |
|---|---|---|---|---|---|---|---|
| 1 | 70 | 25 | 24,872 | 1 | 29% | 27% | 31% |
| 2 | 104 | 55 | 58,215 | 0 | 77% | 11% | 42% |
| 3 | 126 | 37 | 55,613 | 2 | 33% | 8% | 72% |
Overlap (LCA)
Clusters
Your turn
![]()
- Huddle up in your groups
- Discuss how you might want to segment the data you are collecting for KCRW, if at all
- Which data would you use for the clustering algorithm?
- Which clustering method would be best? Why?
