Data Storytelling
Overview
Best practices for presenting your findings and engaging decision-makers.
Presented to:
MKT 512
January 29, 2026
MKT 512
January 29, 2026

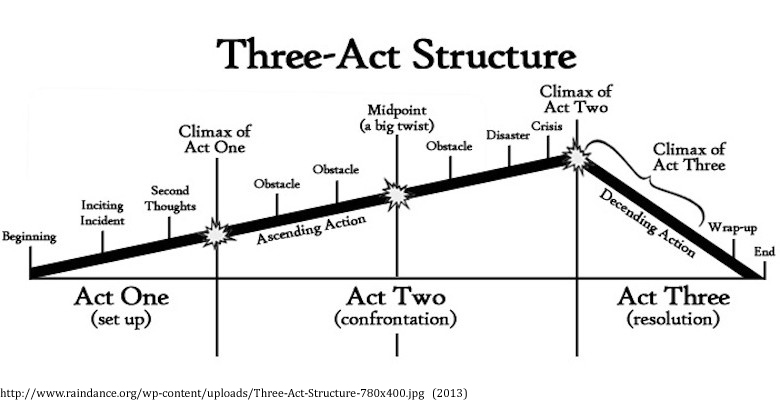
The three-act structure
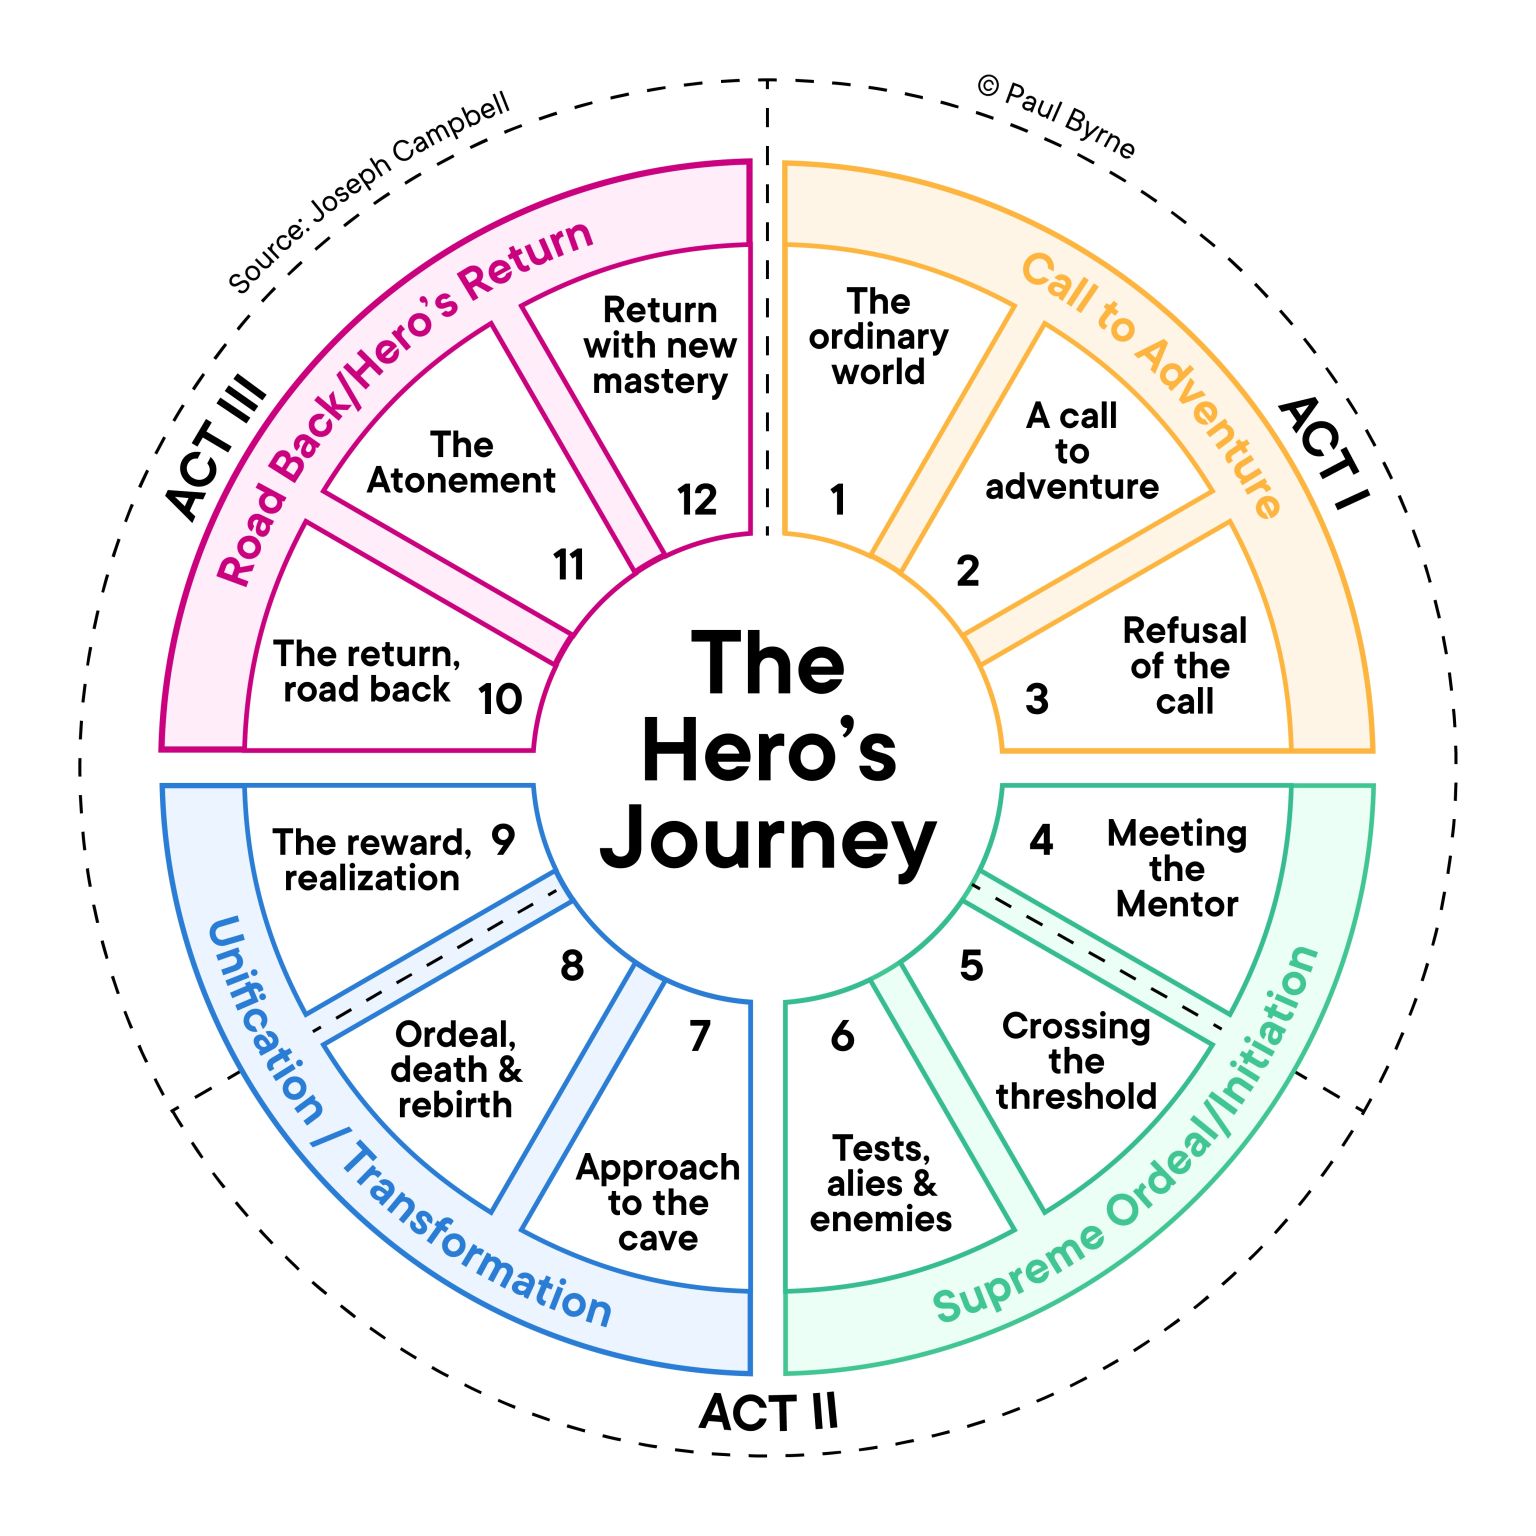
The hero’s journey
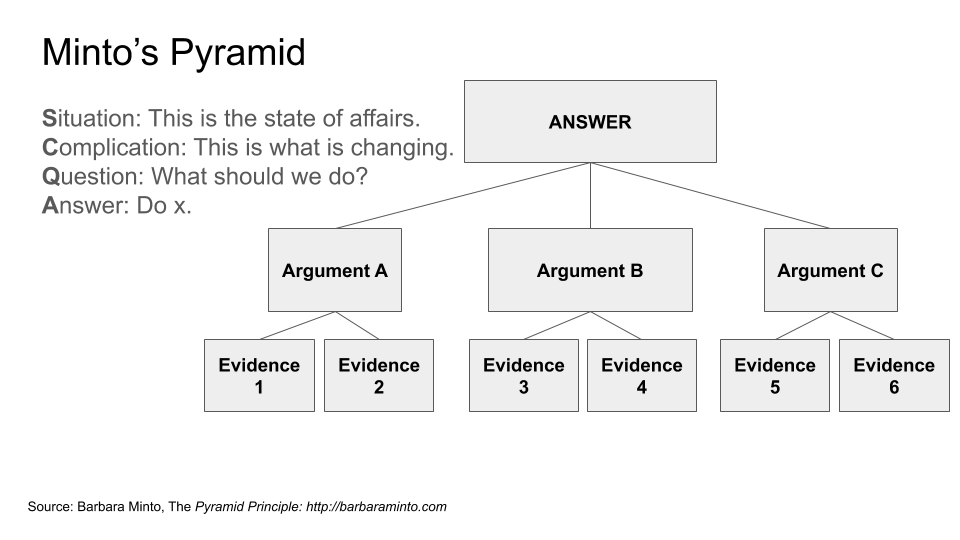
The Pyramid Principle
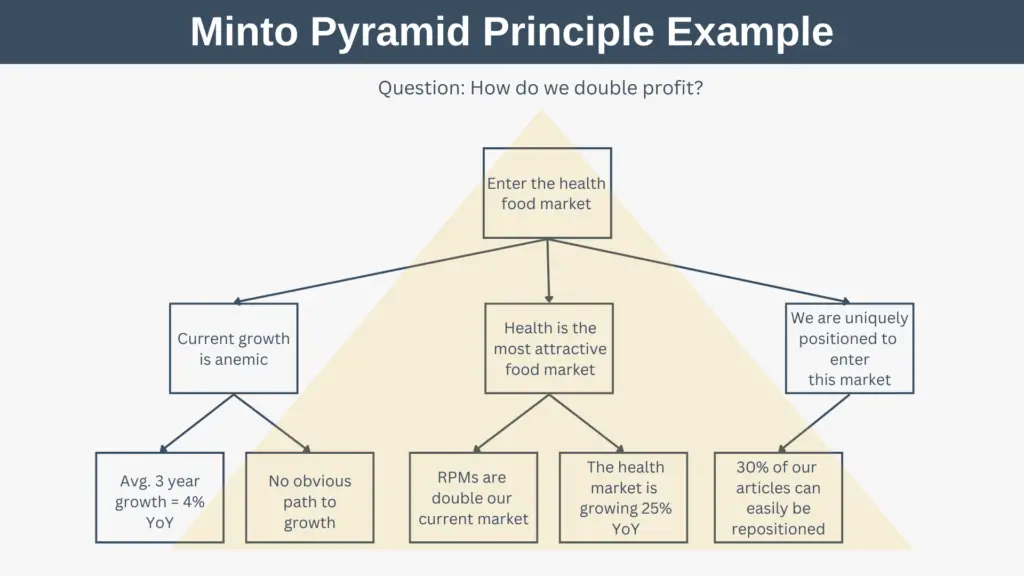
SCQA
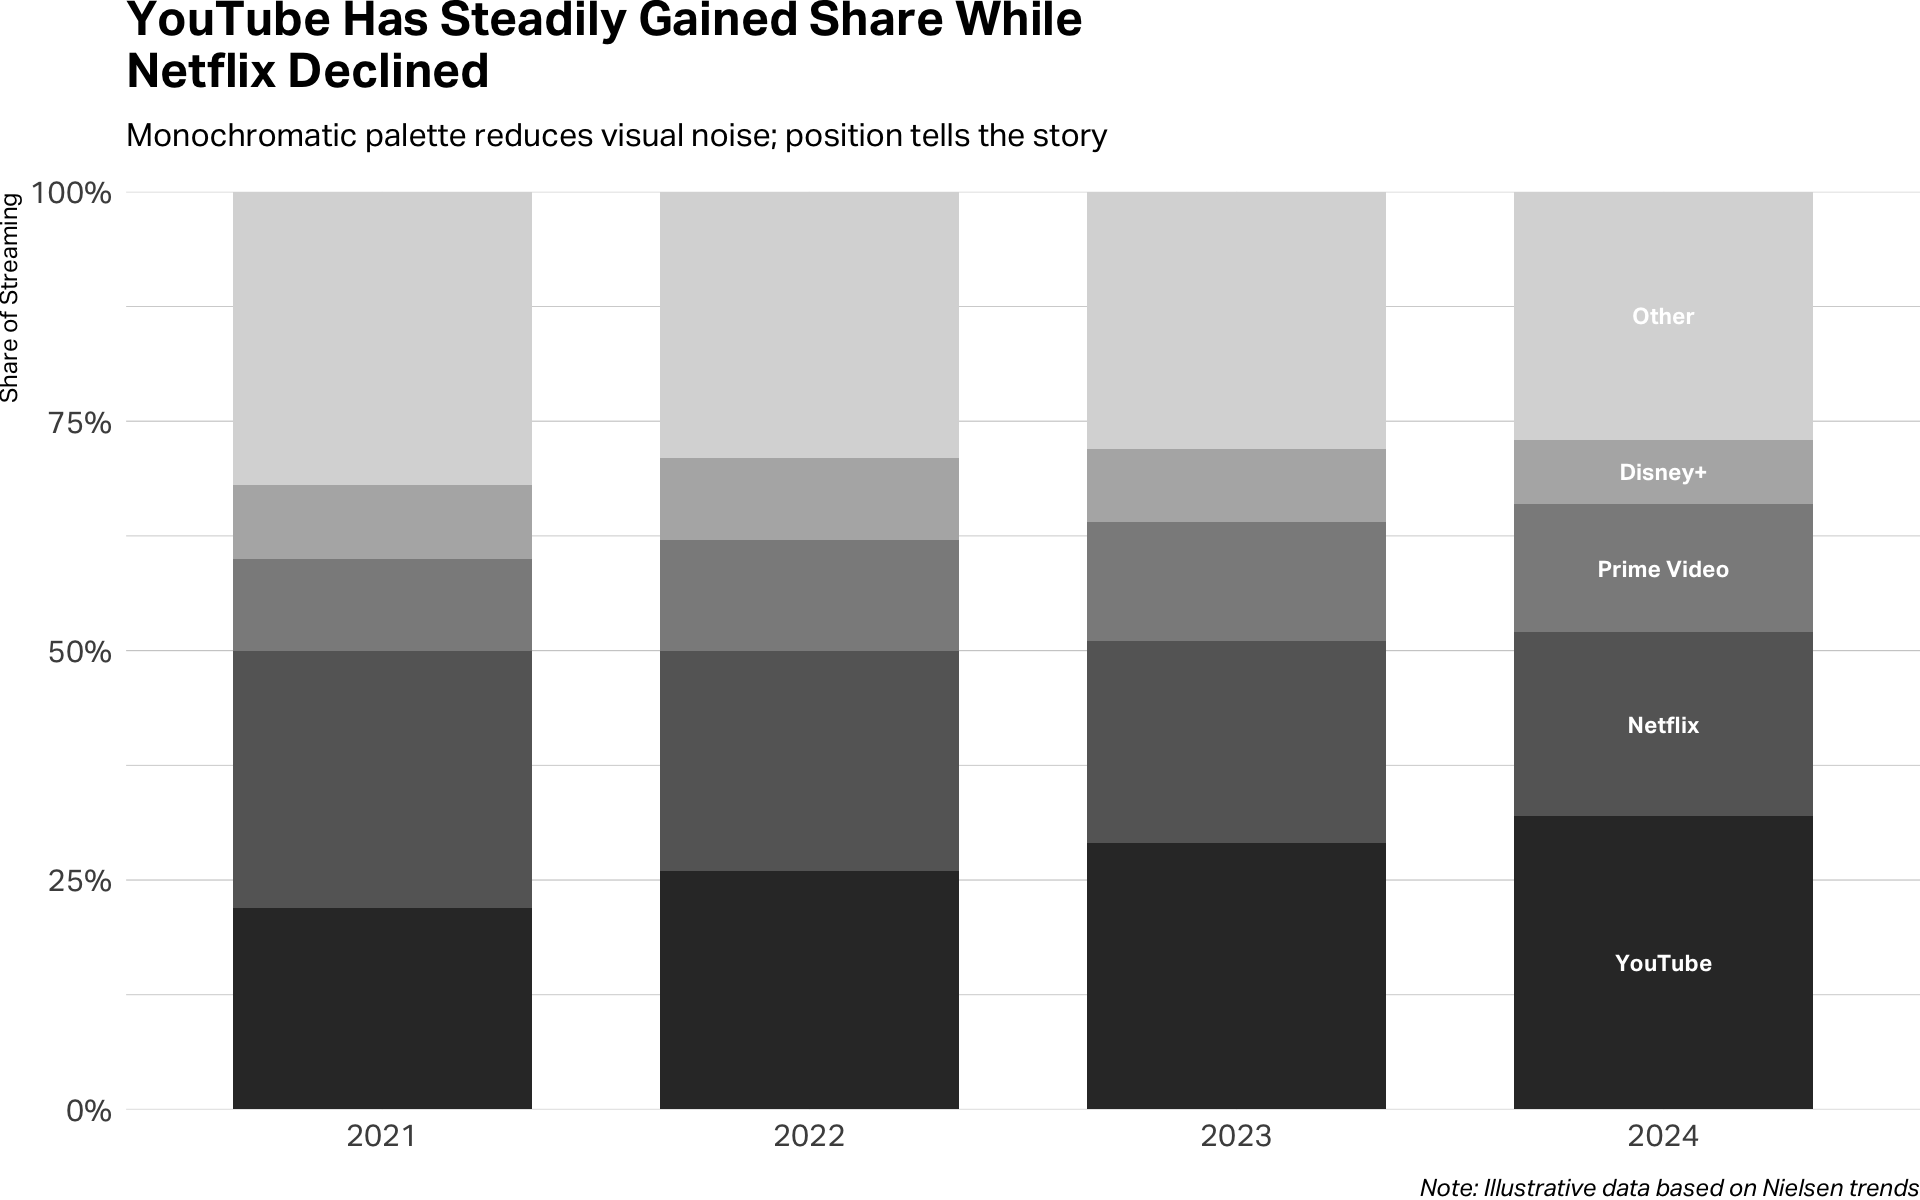
Let your evidence tell the story
Proportions
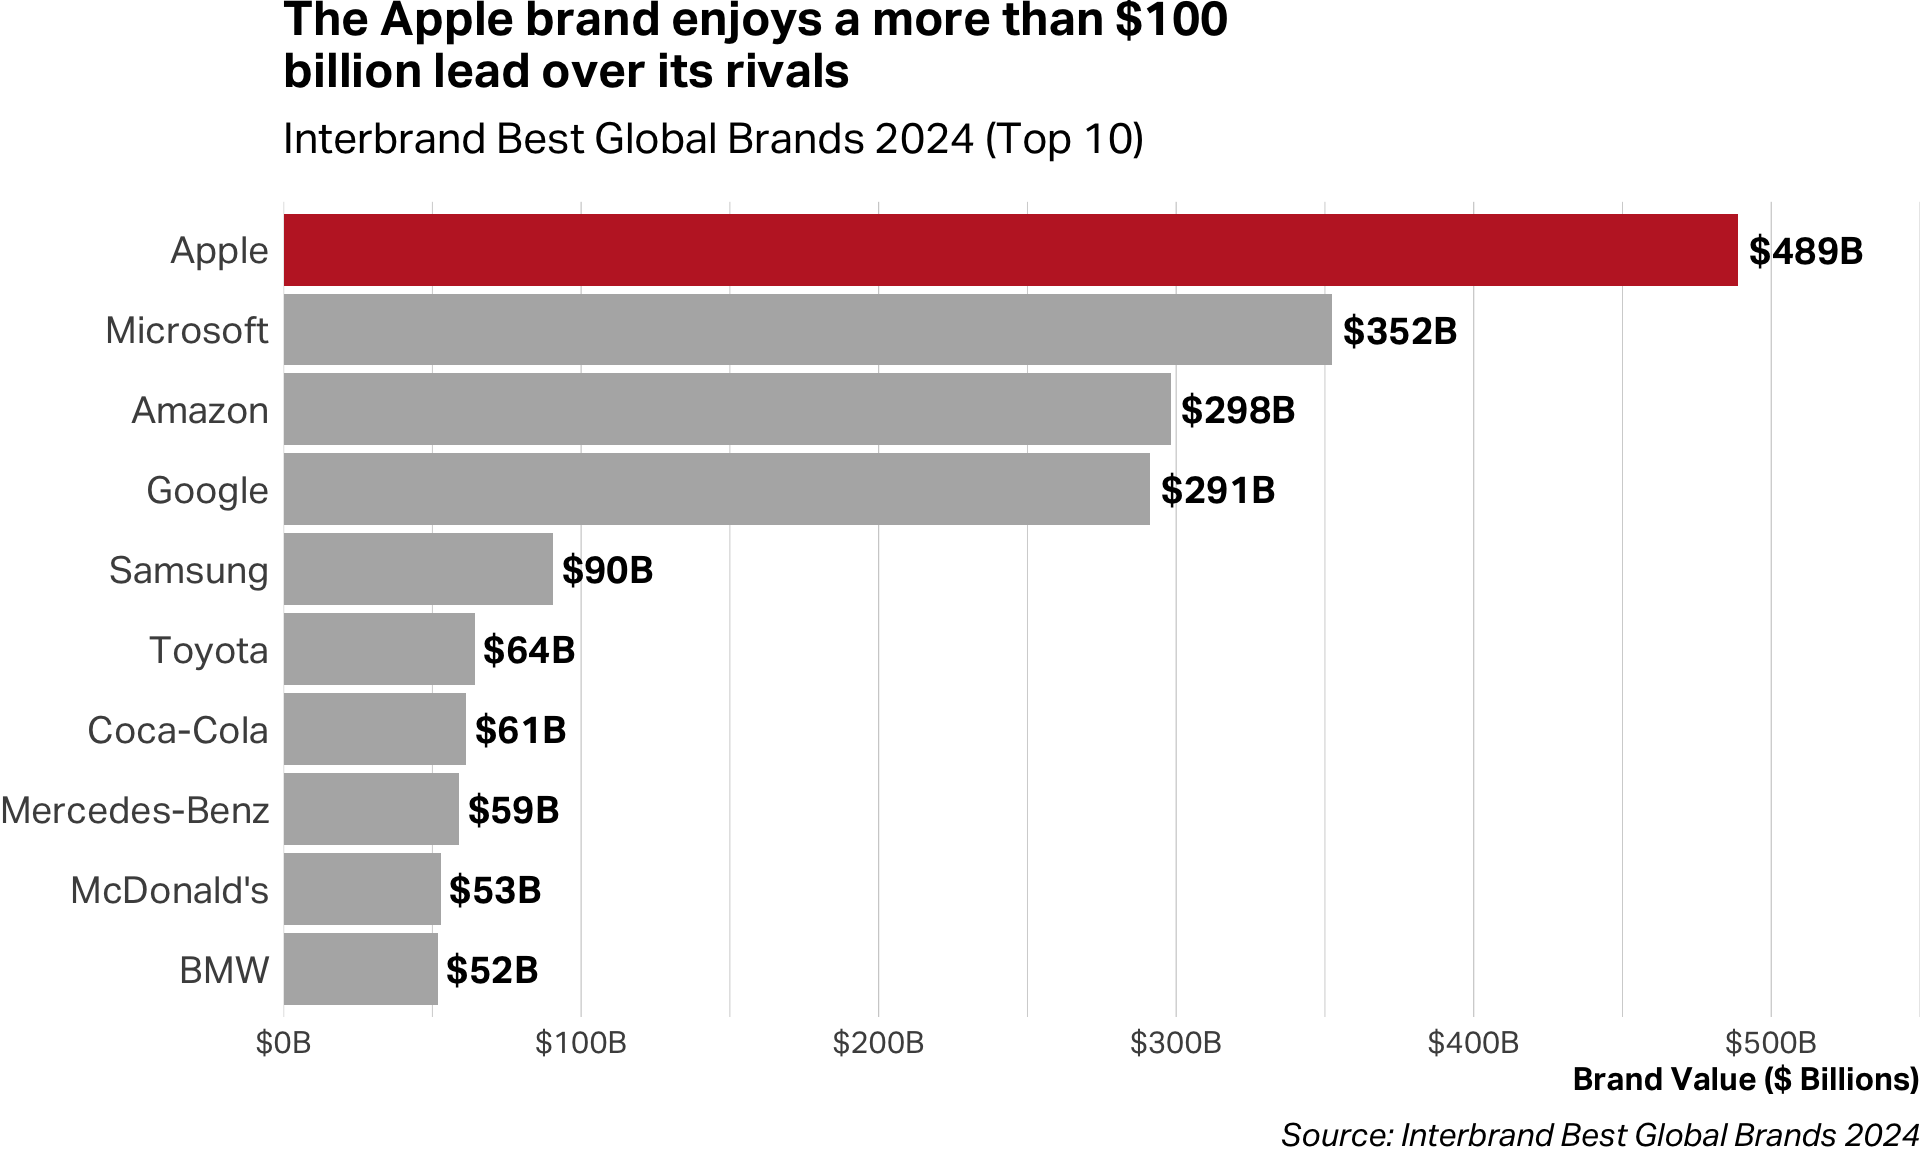
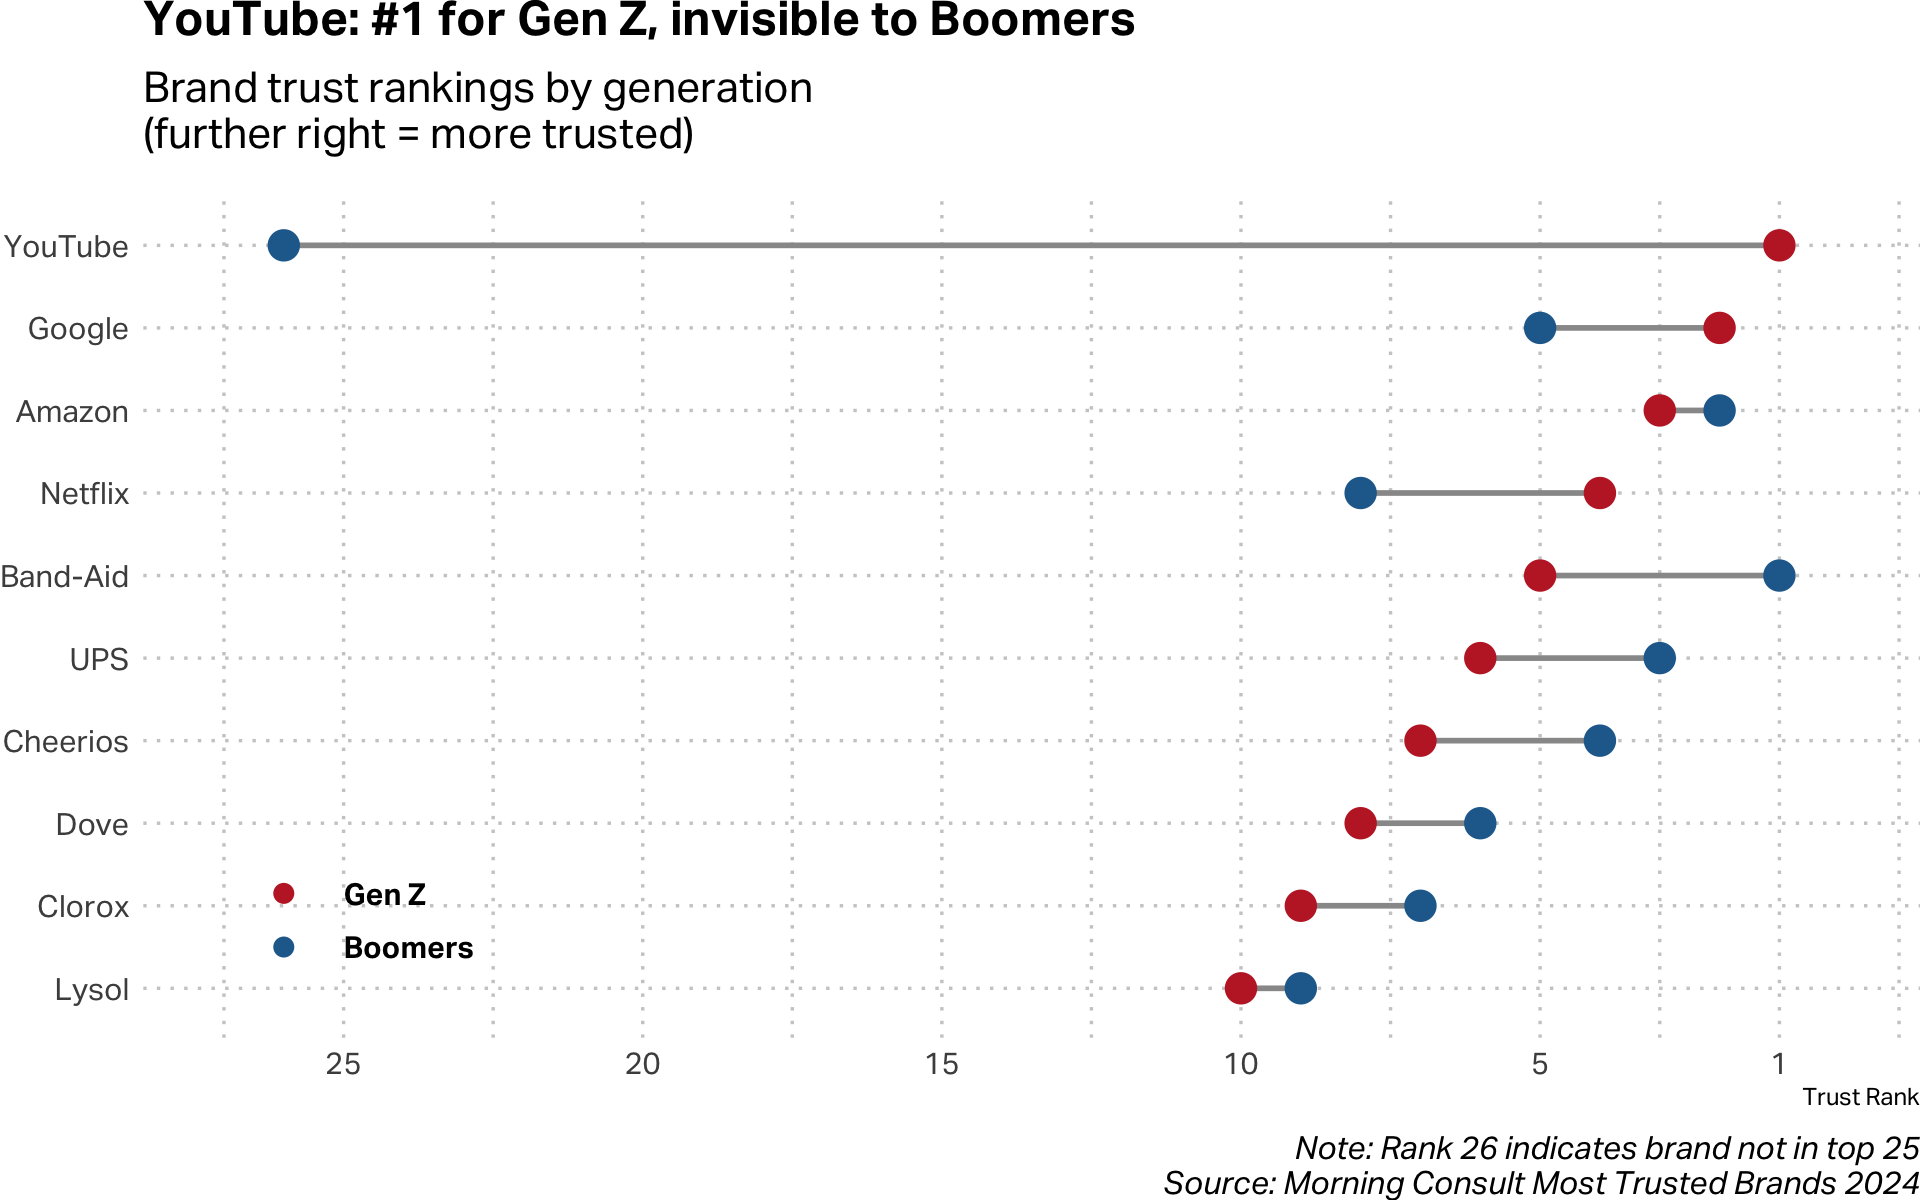
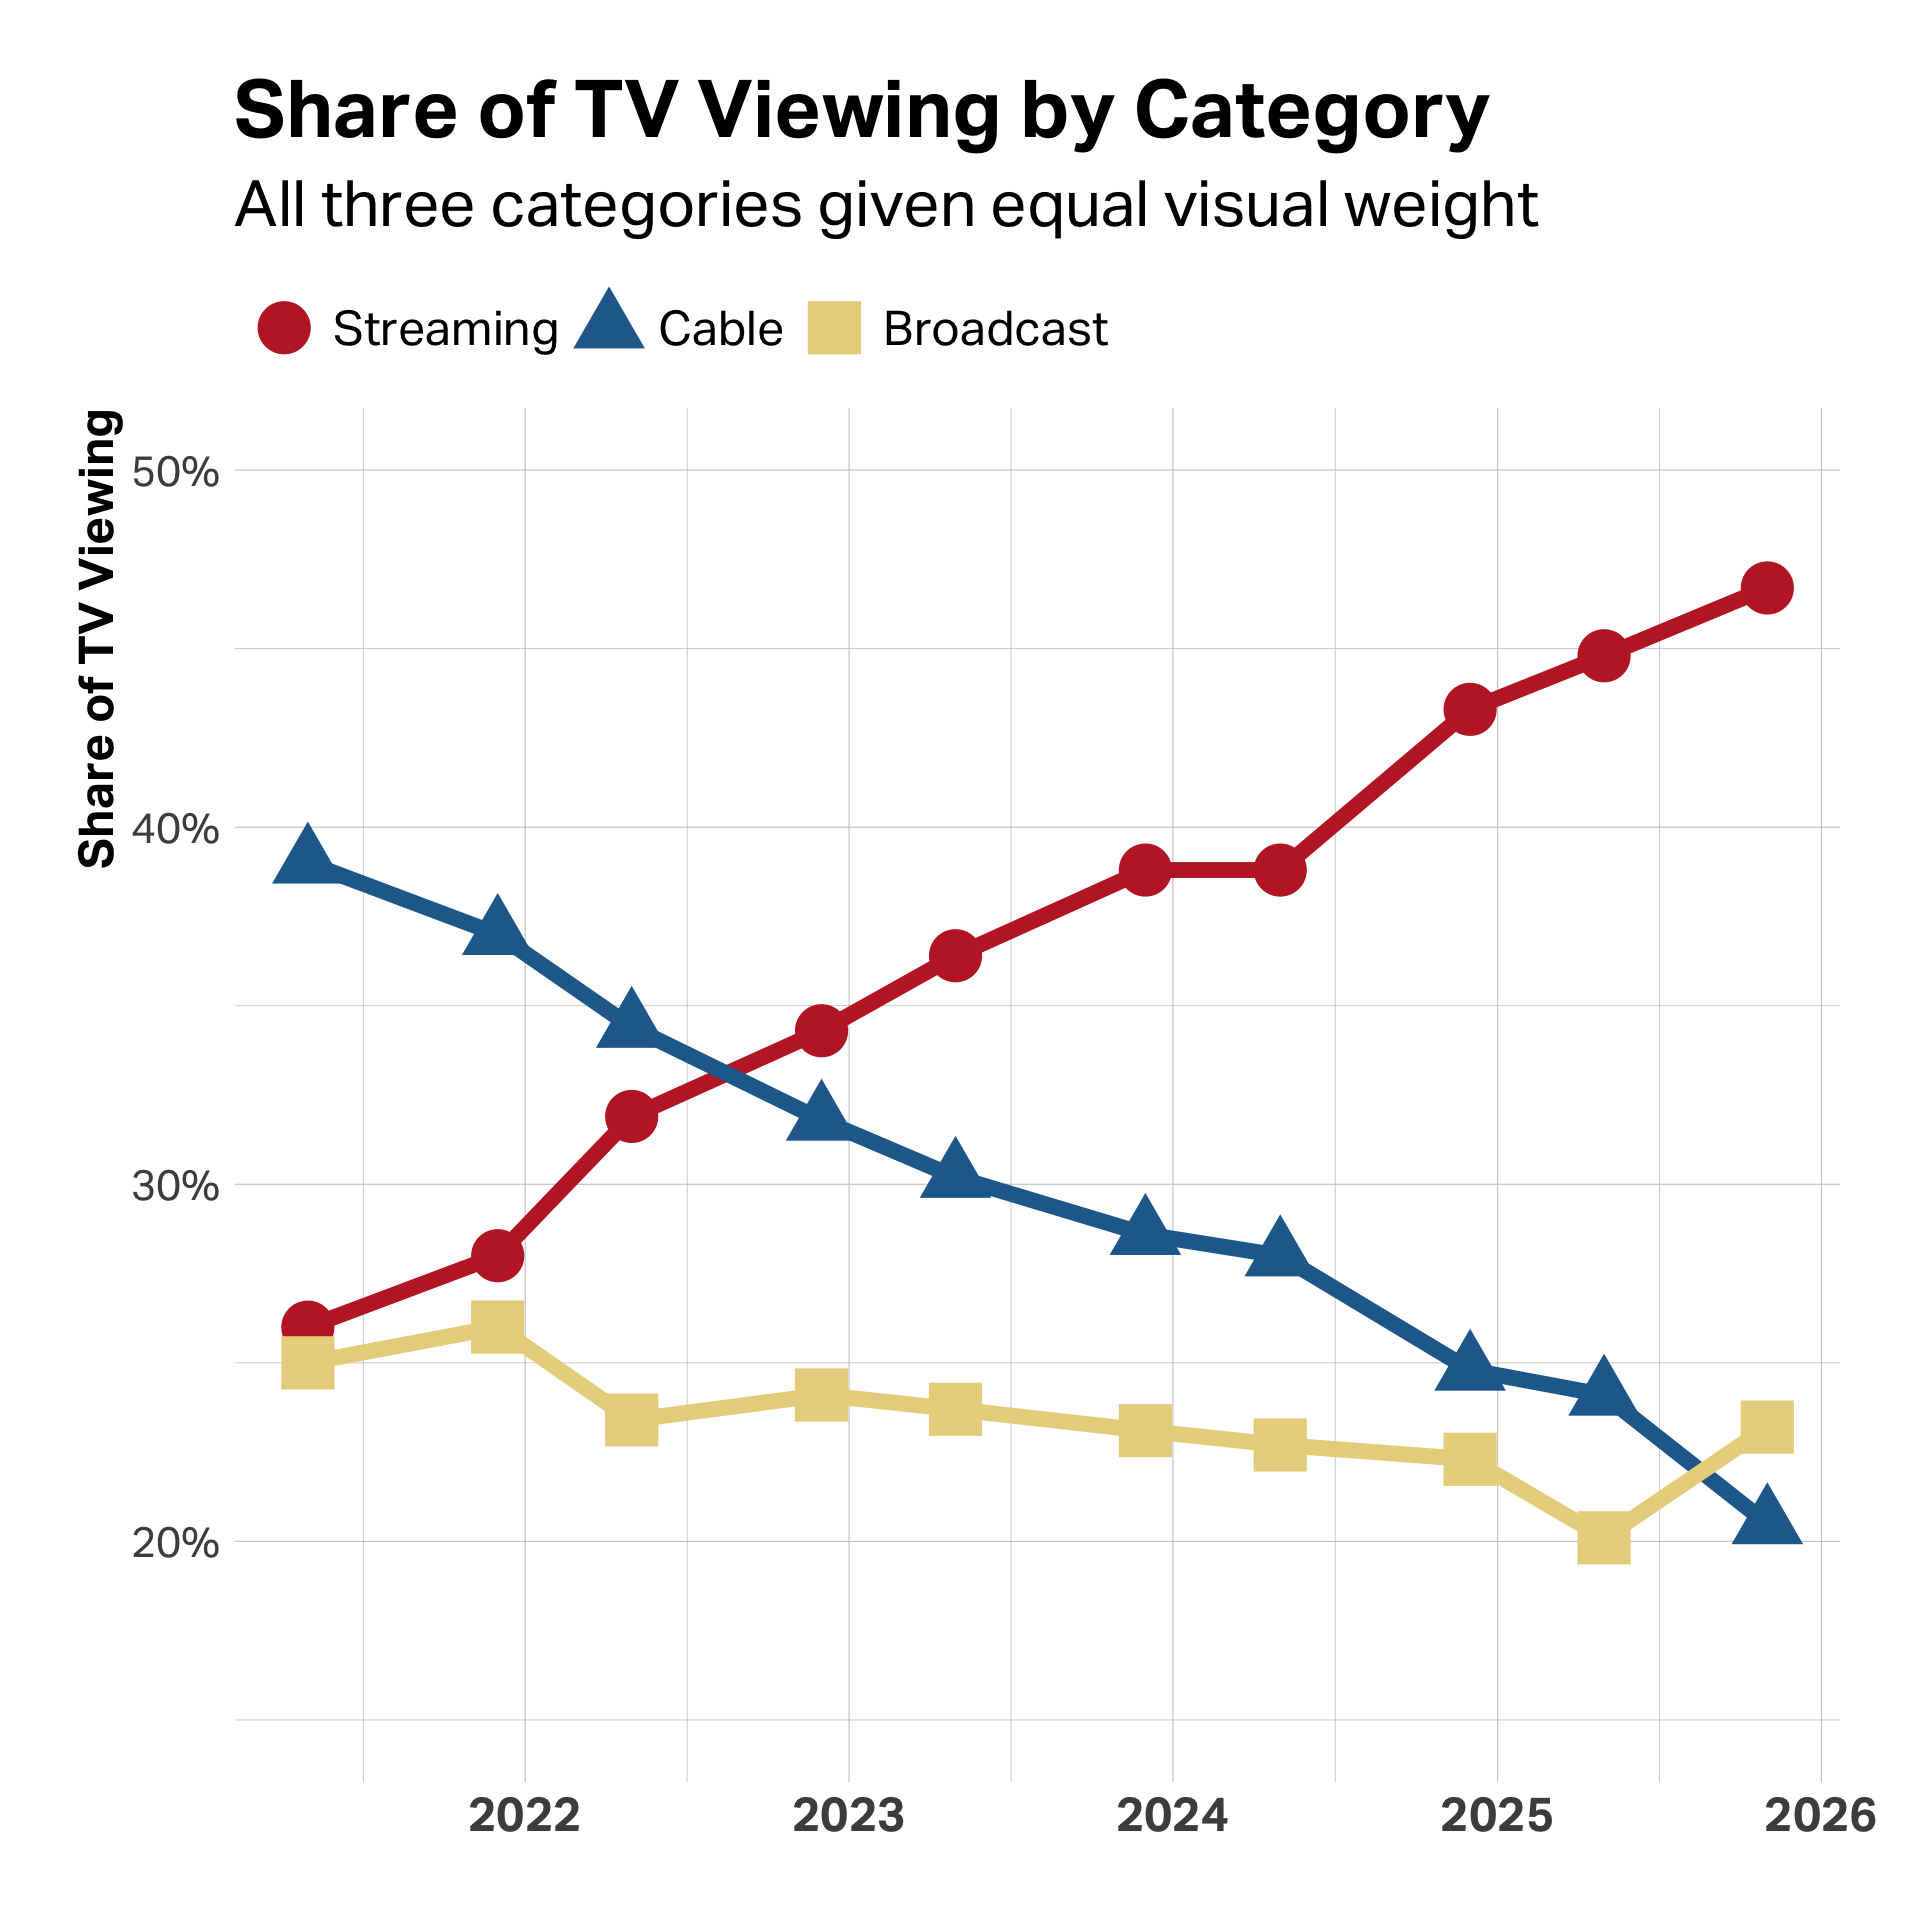
Comparisons
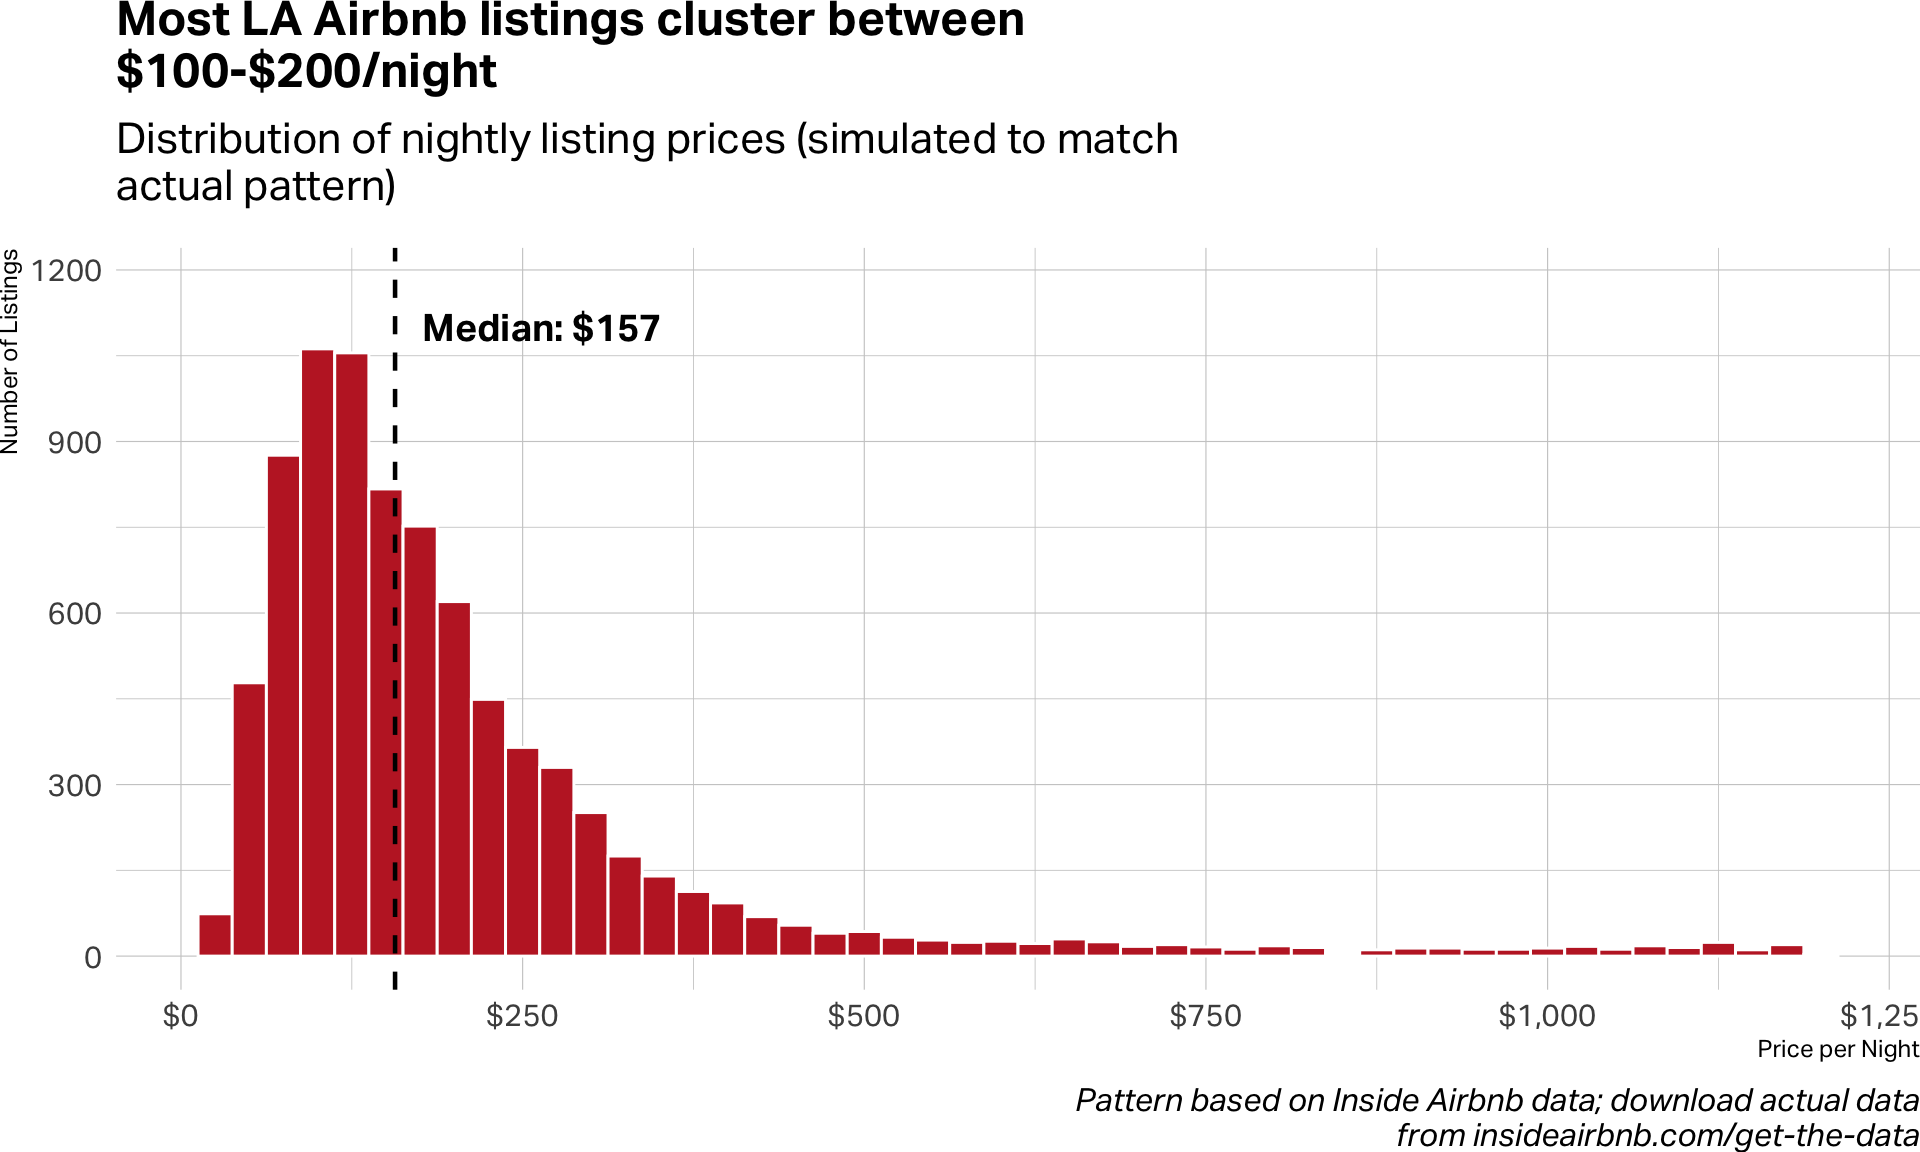
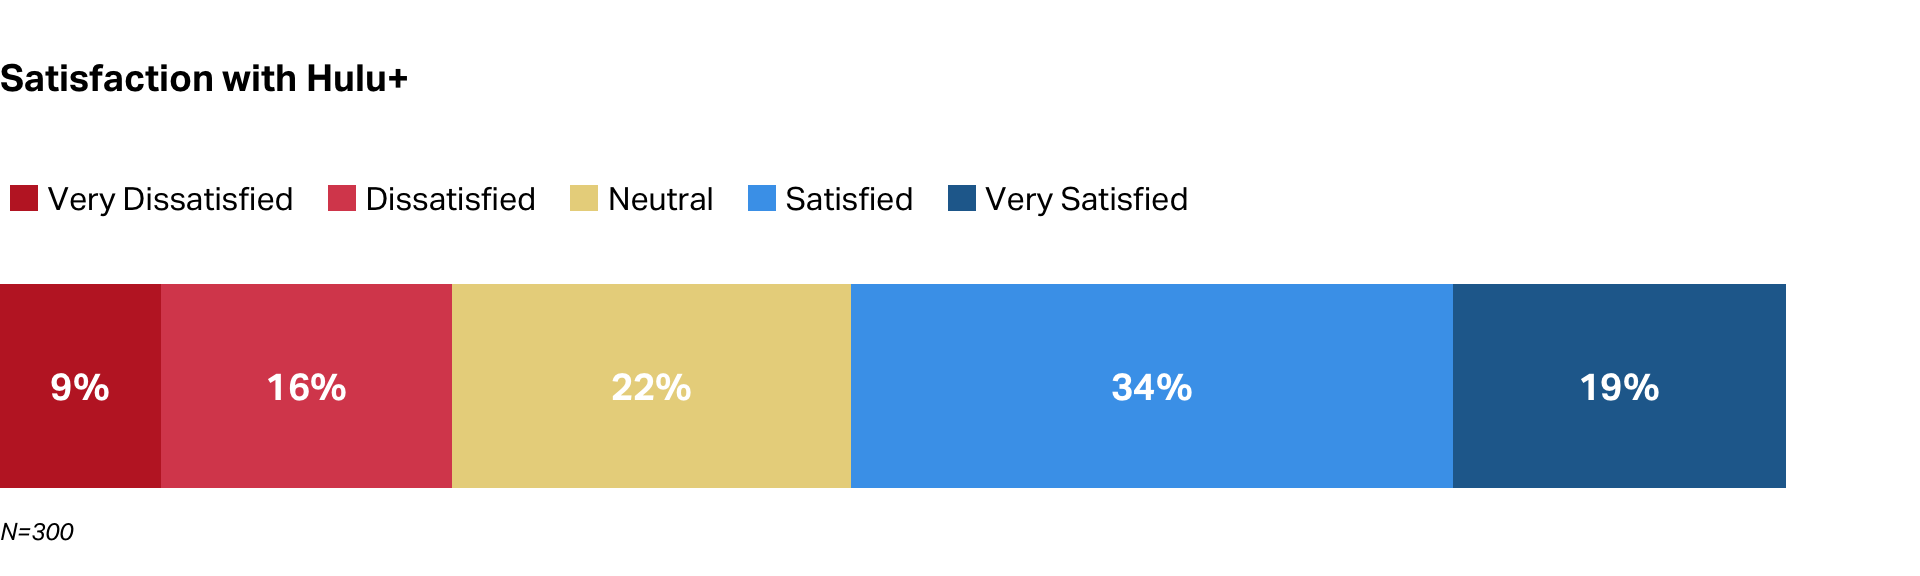
Distributions
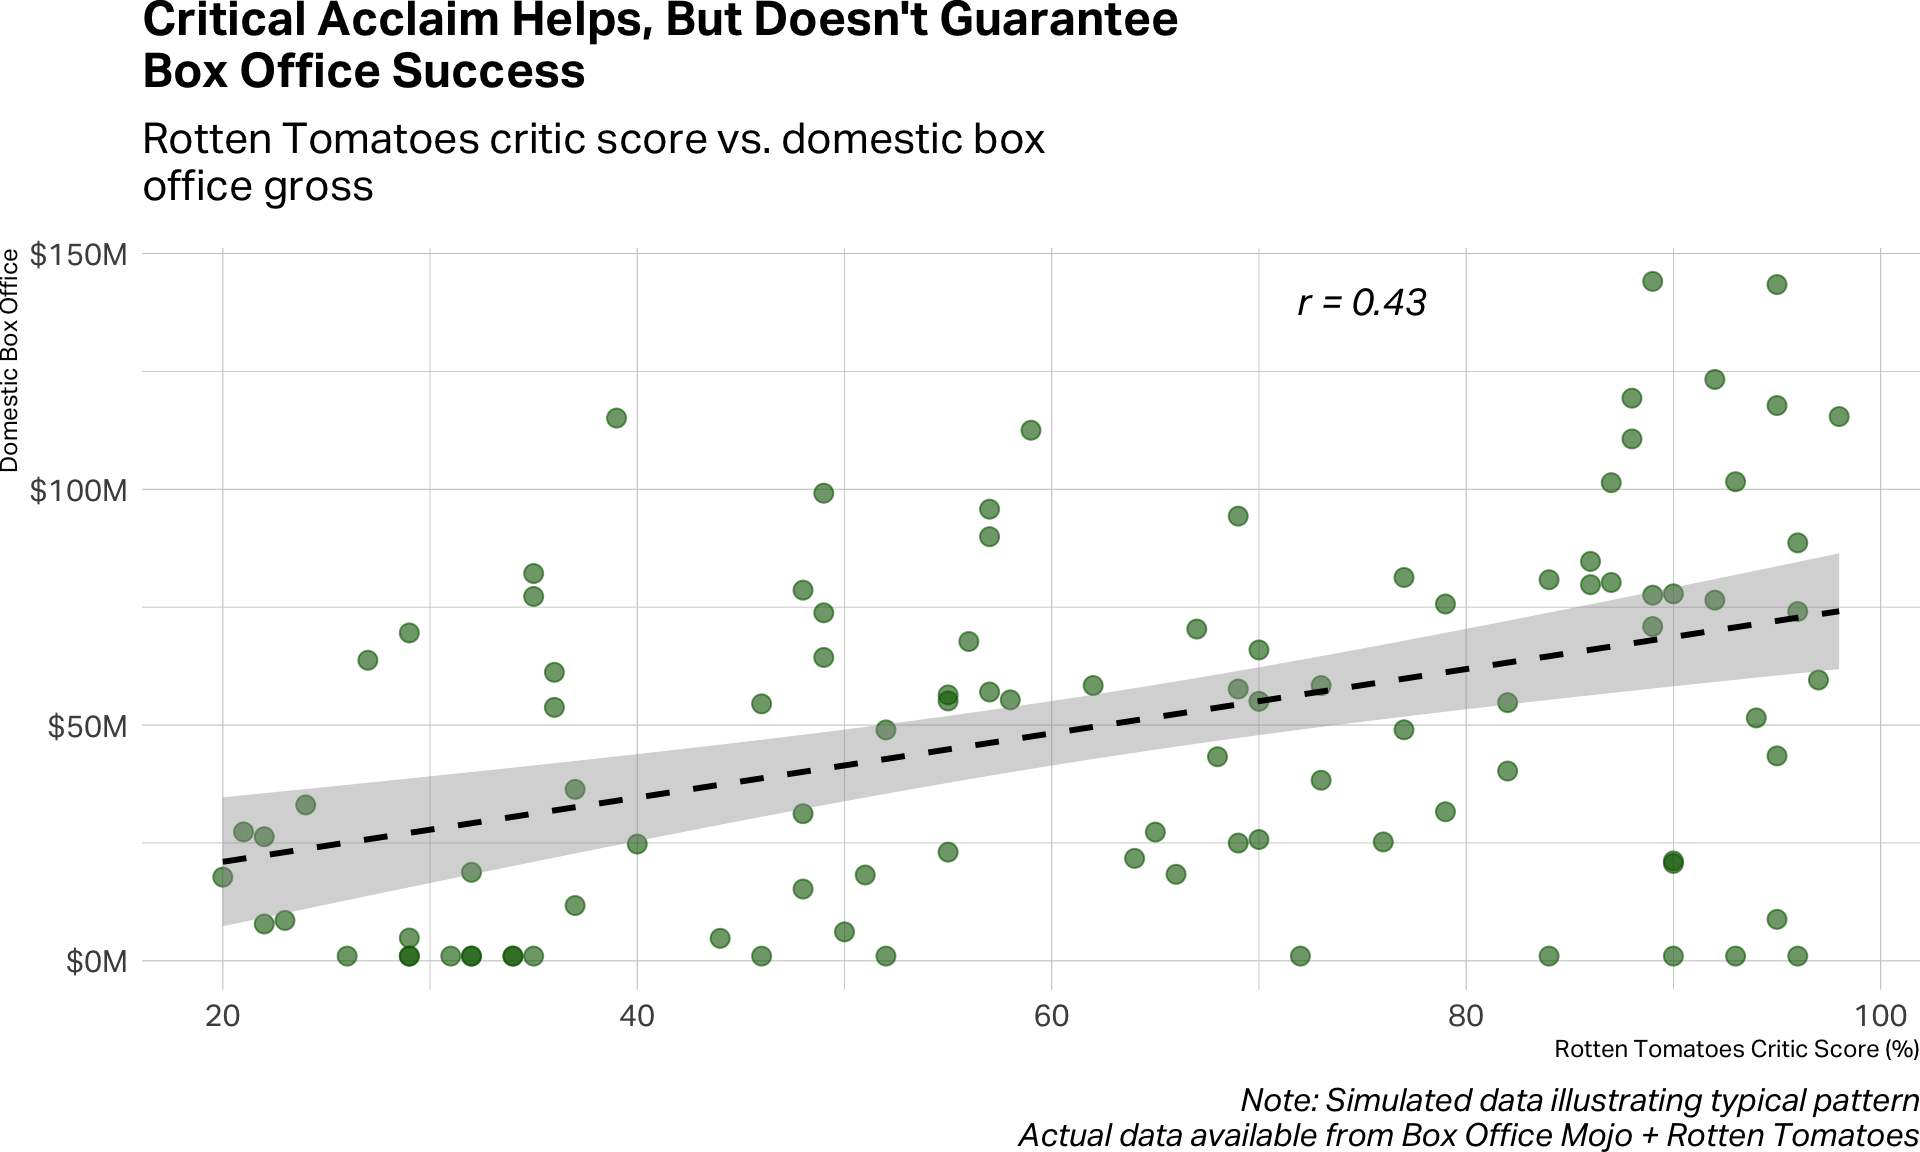
Relationships
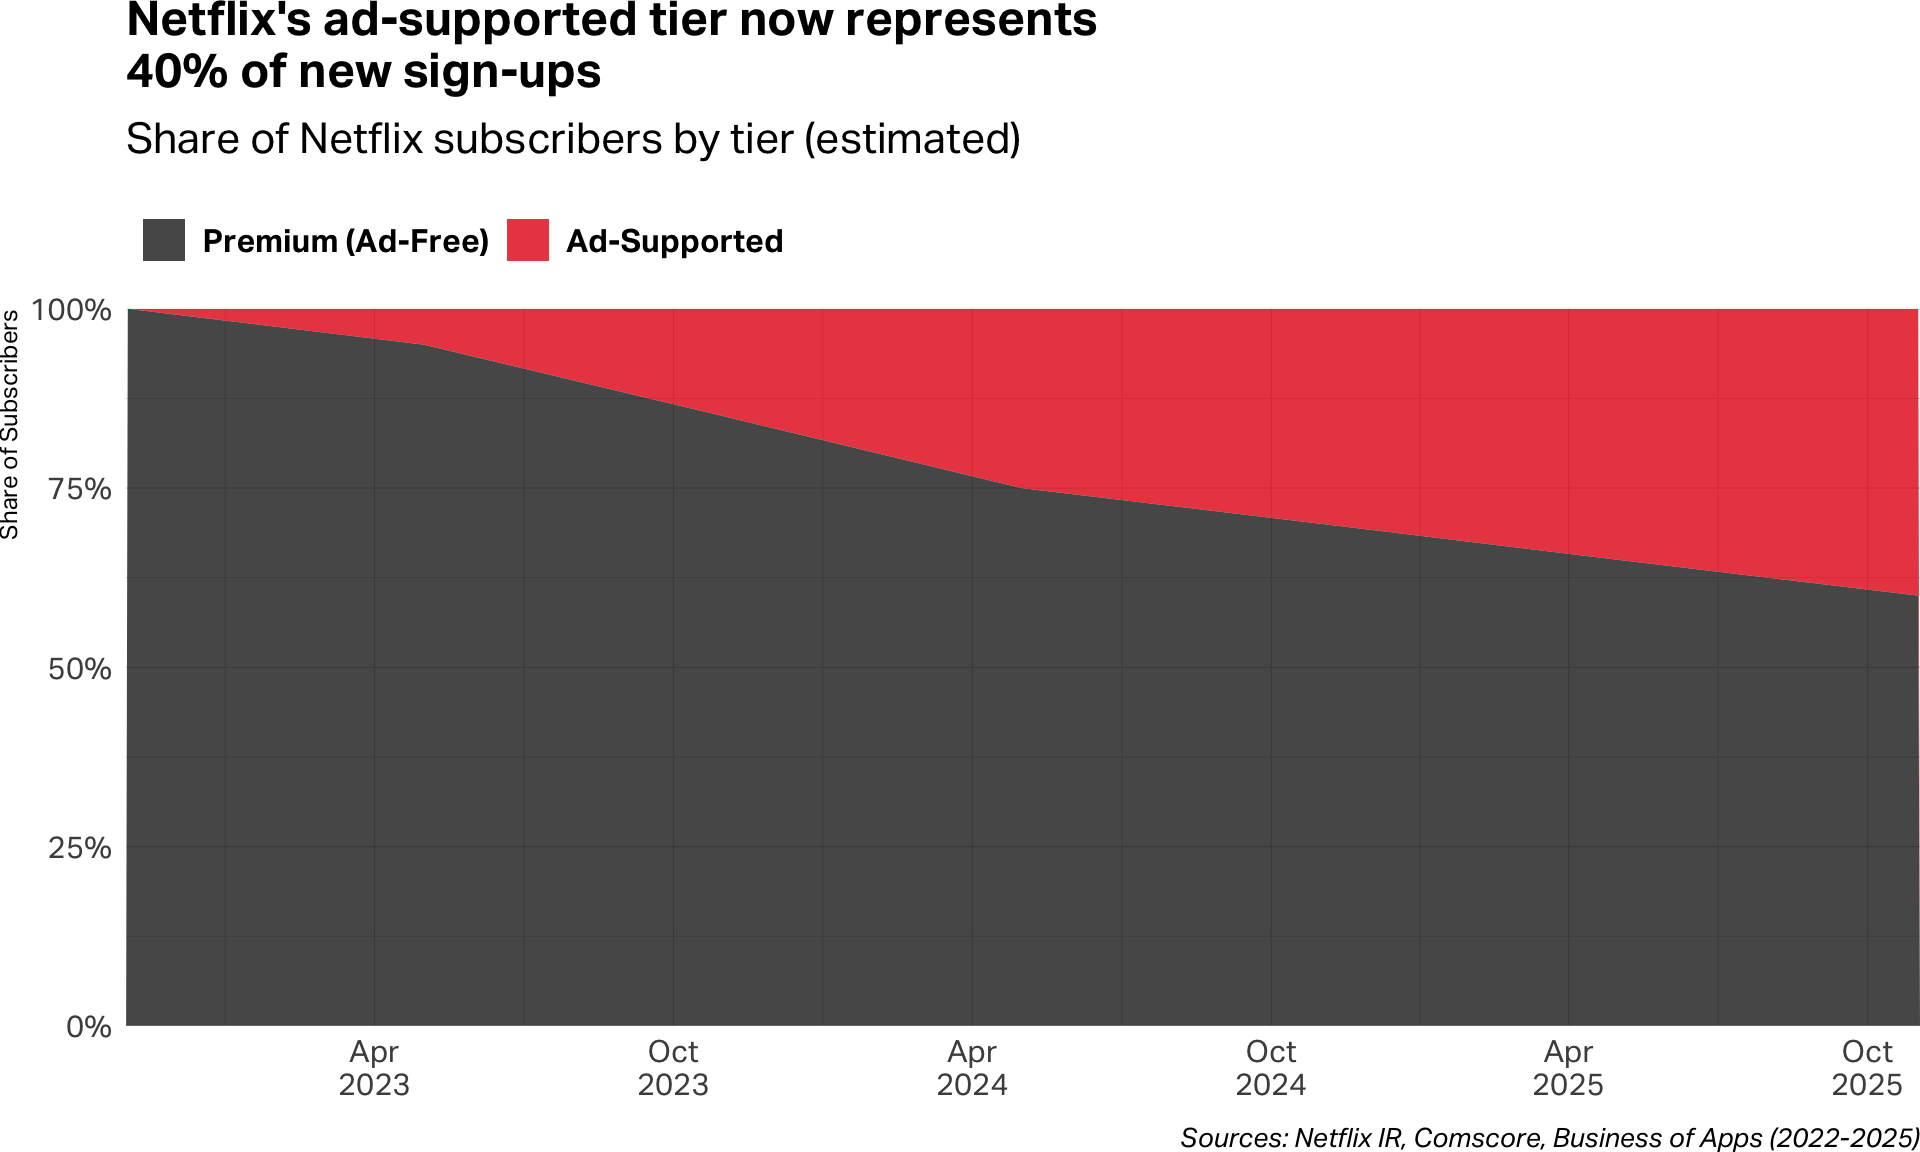
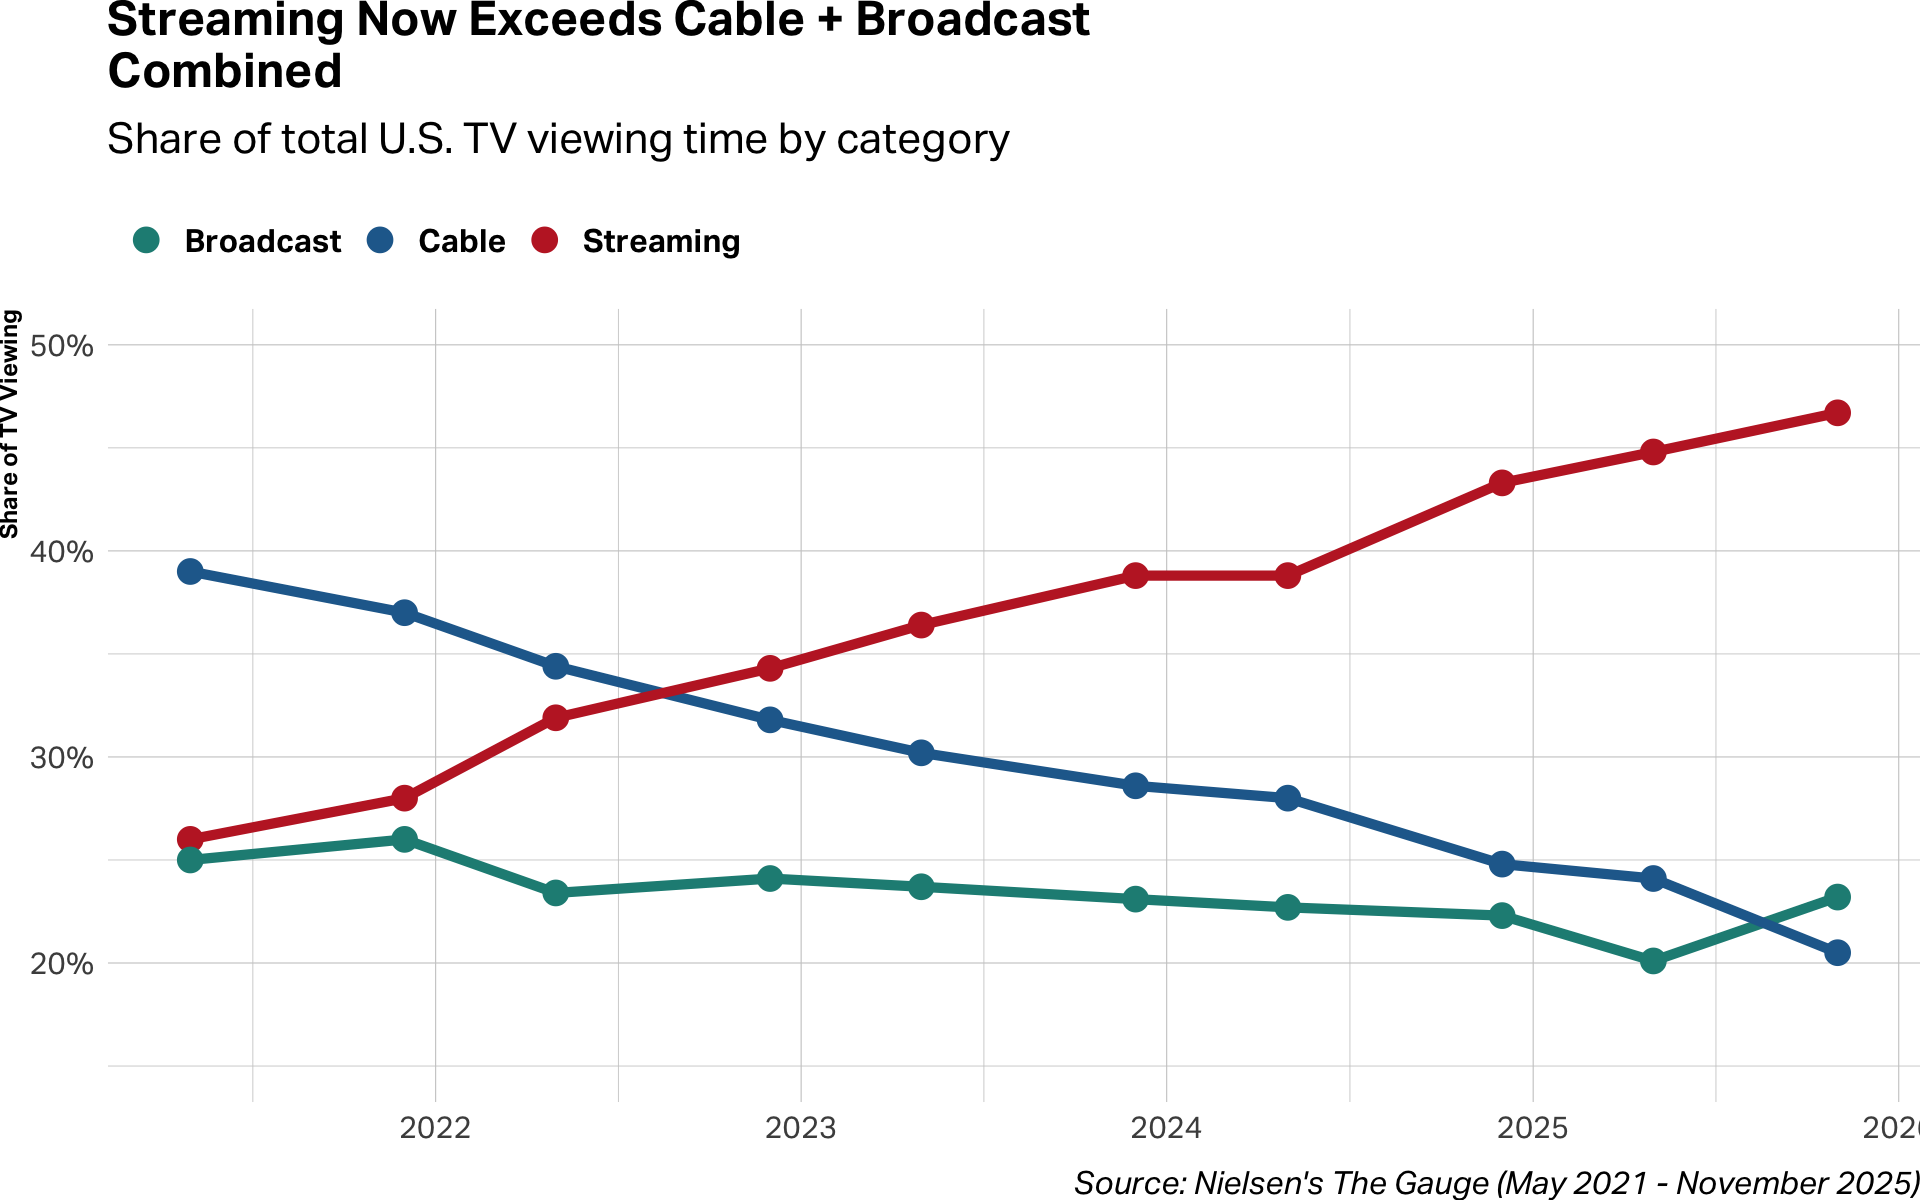
Change over time
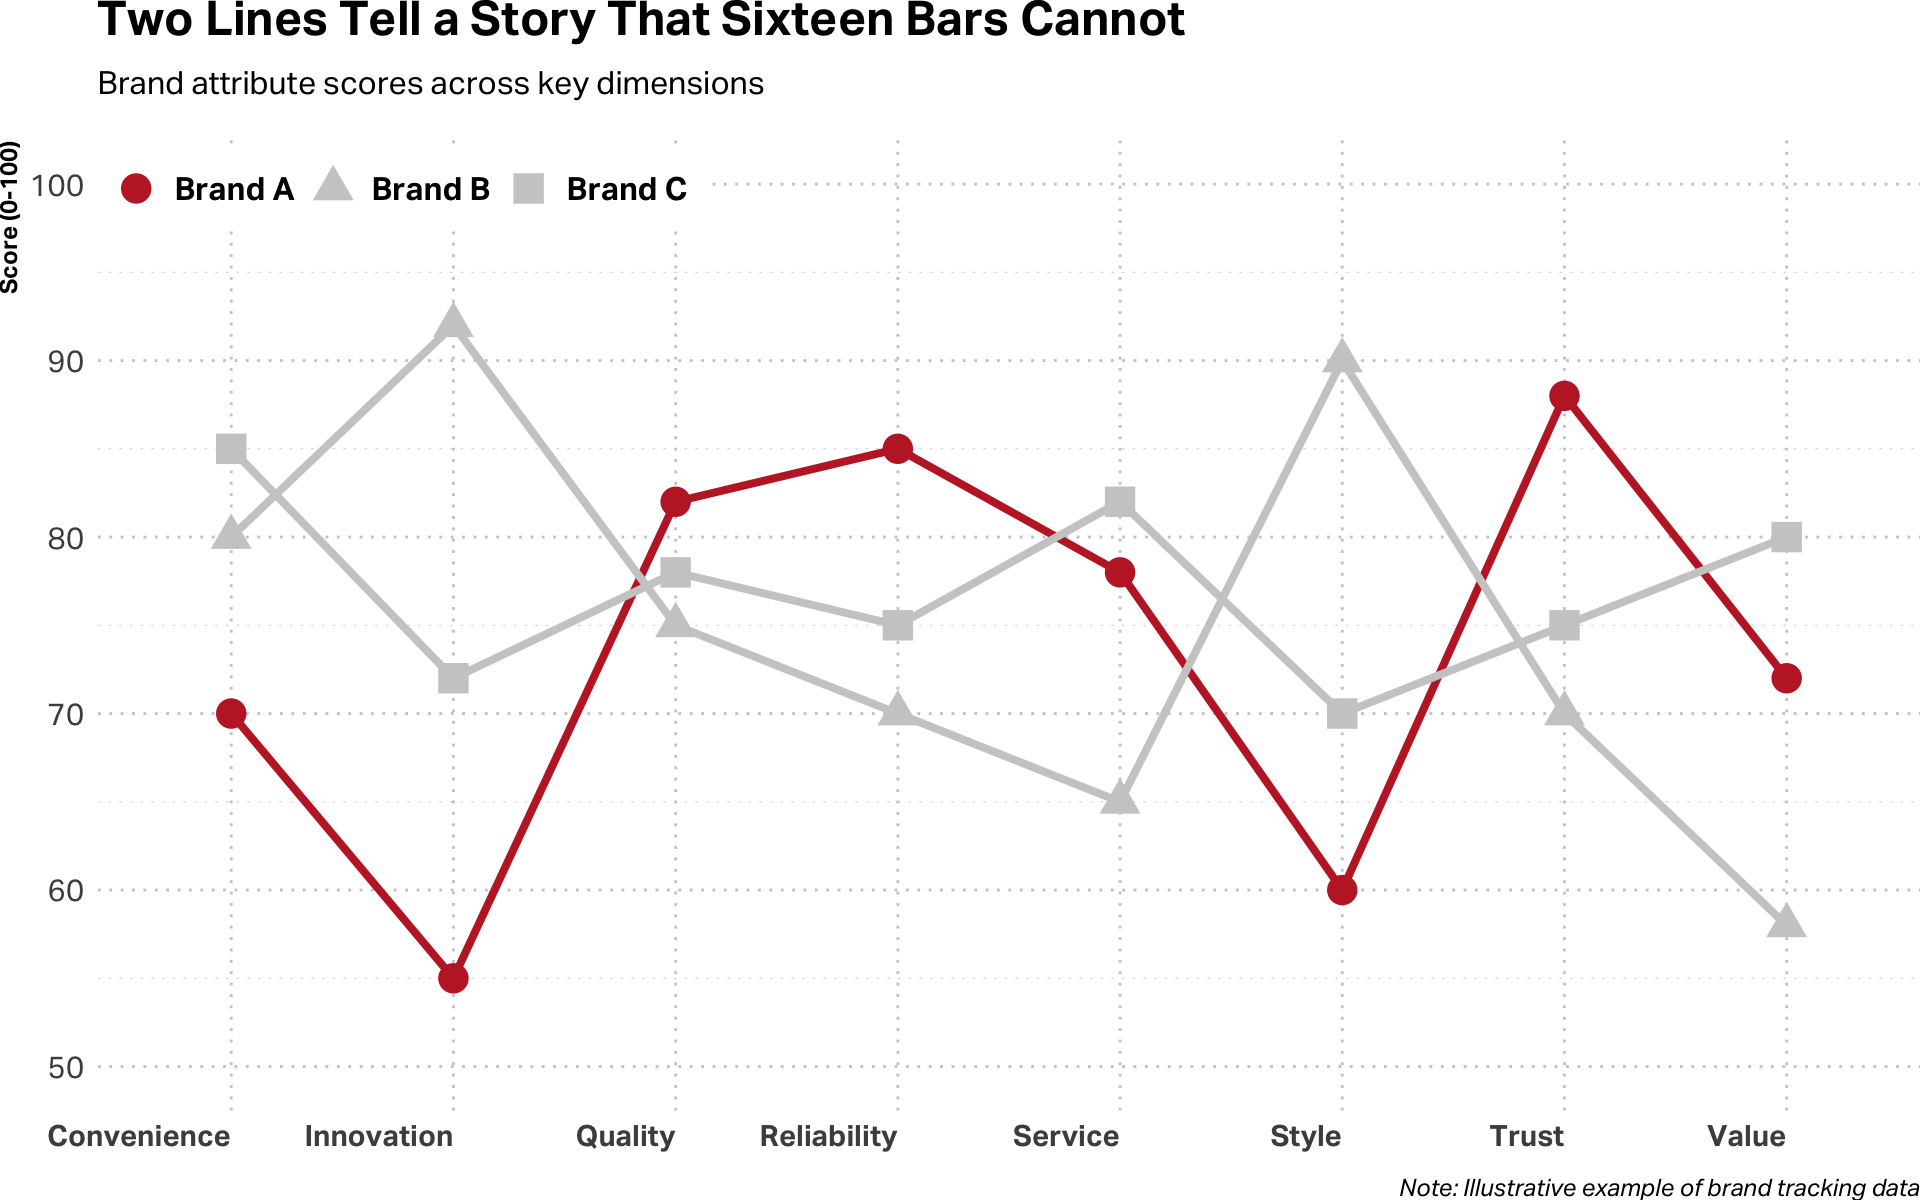
Complex comparisons
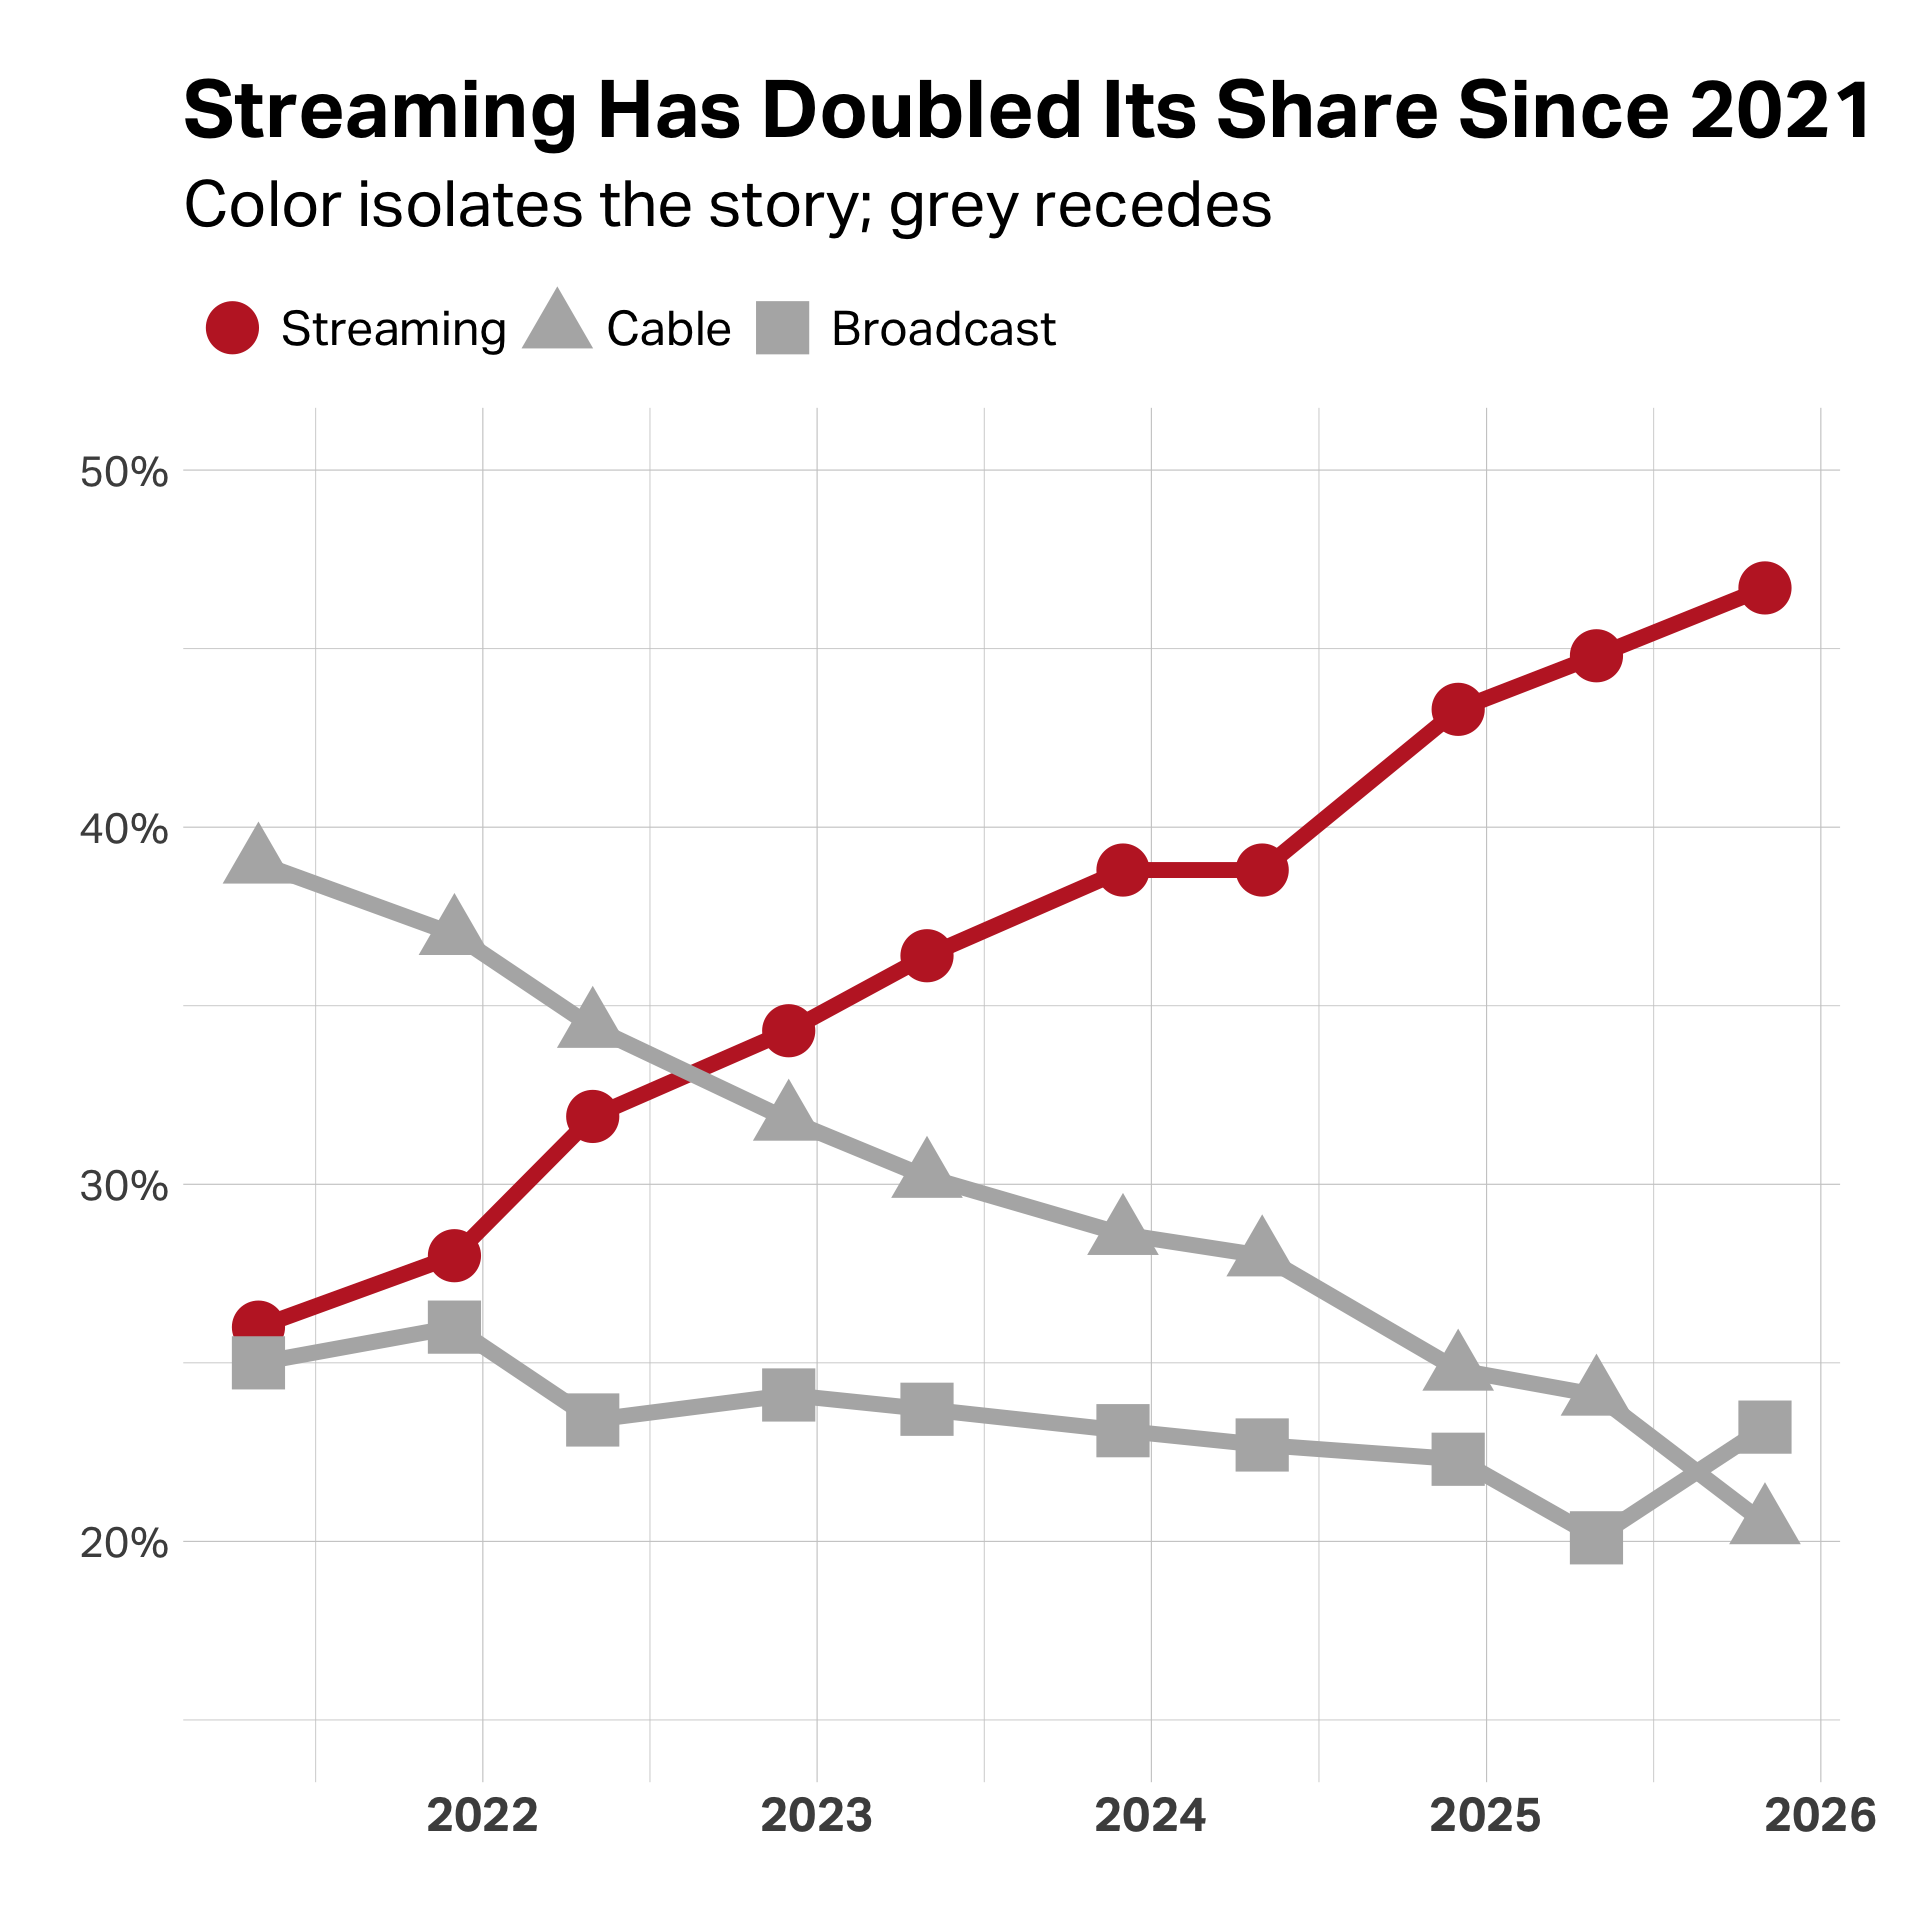
Isolation through color
Contrast
Gradation