| % of Grade | Points | |
|---|---|---|
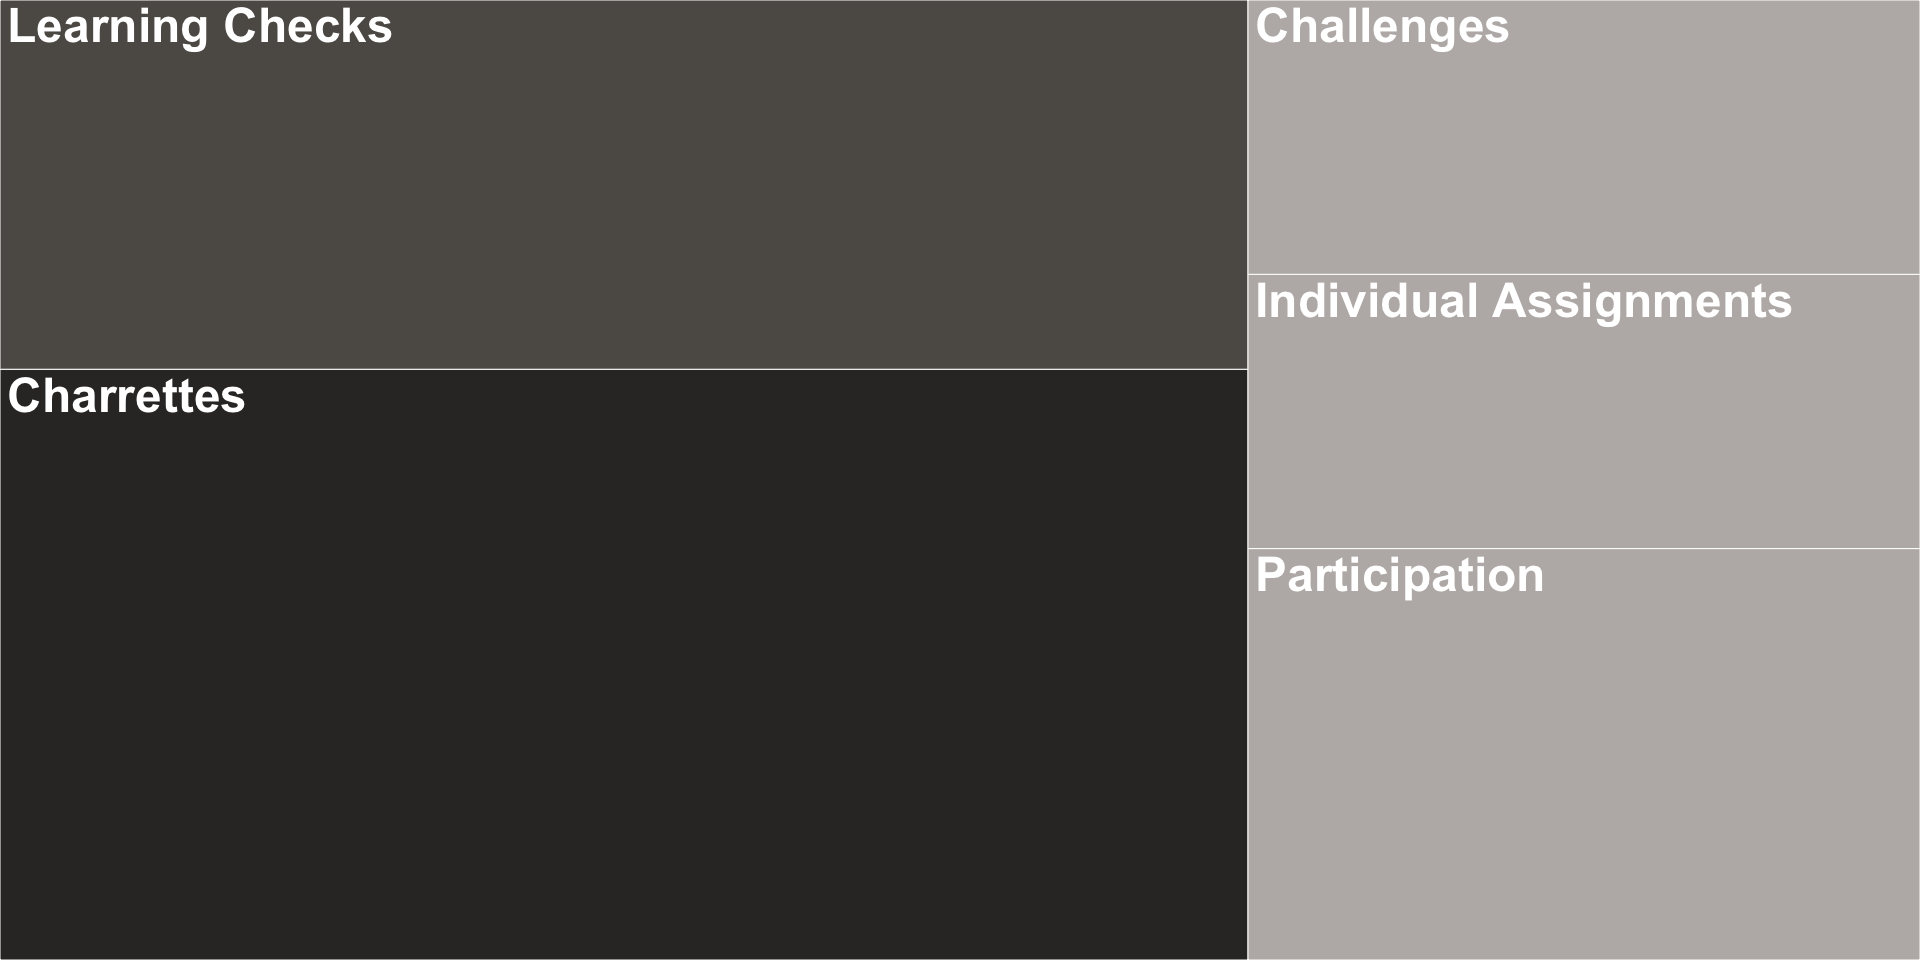
| Class Participation | 15% | 15 |
| Challenges | 10% | 10 |
| Individual Assignments (2) | 10% | 10 |
| Learning Checks (2 of 3) | 25% | 25 |
| Charrettes (4) | 40% | 40 |
| Total | 100% | 100 |
January 12, 2026
Customer Insights
& Analysis
Course Introduction
A guided tour of the course and an overview of analytical approaches to customer relationship marketing.
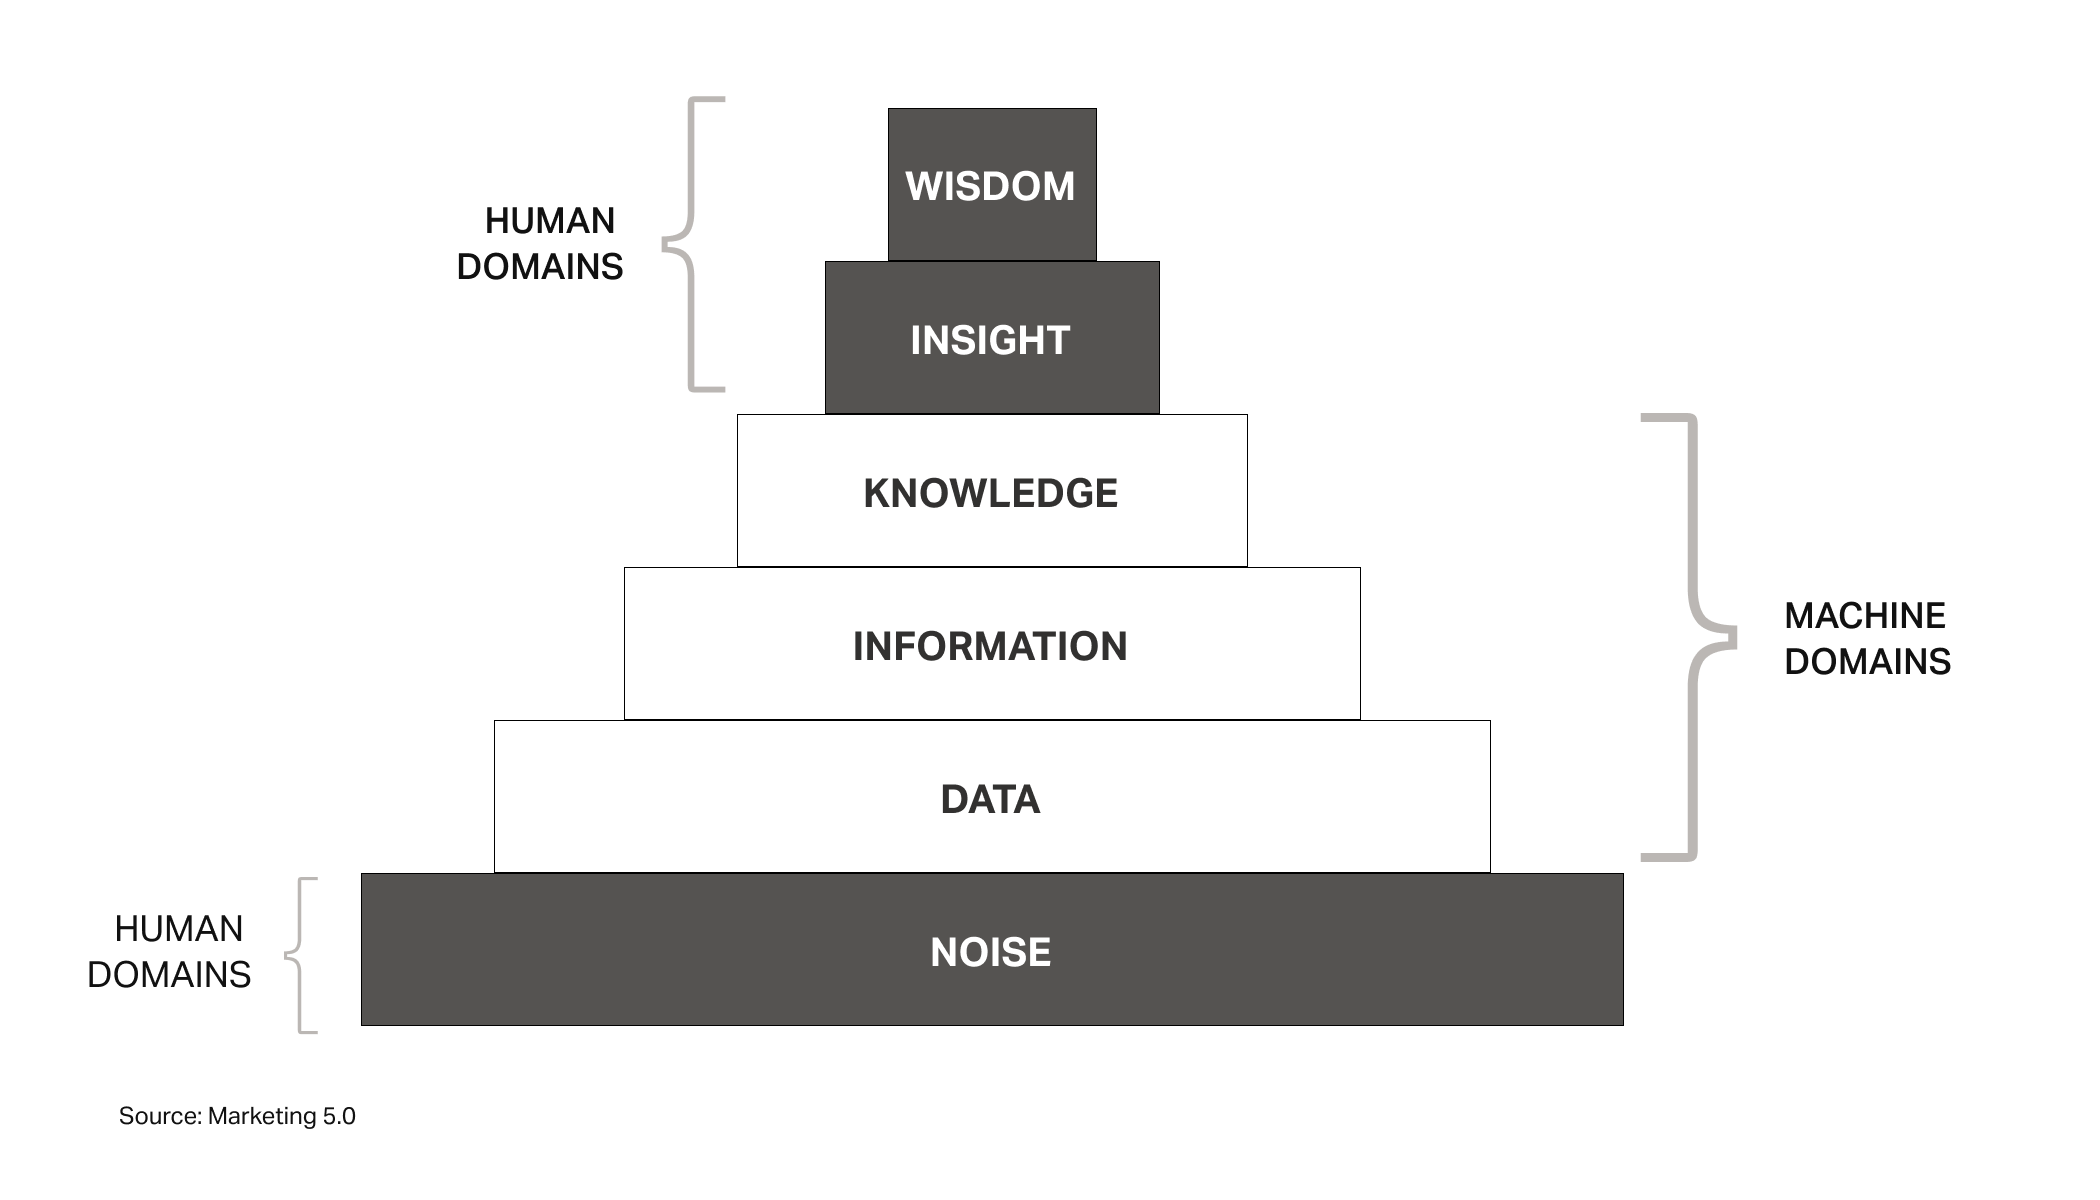
The research process

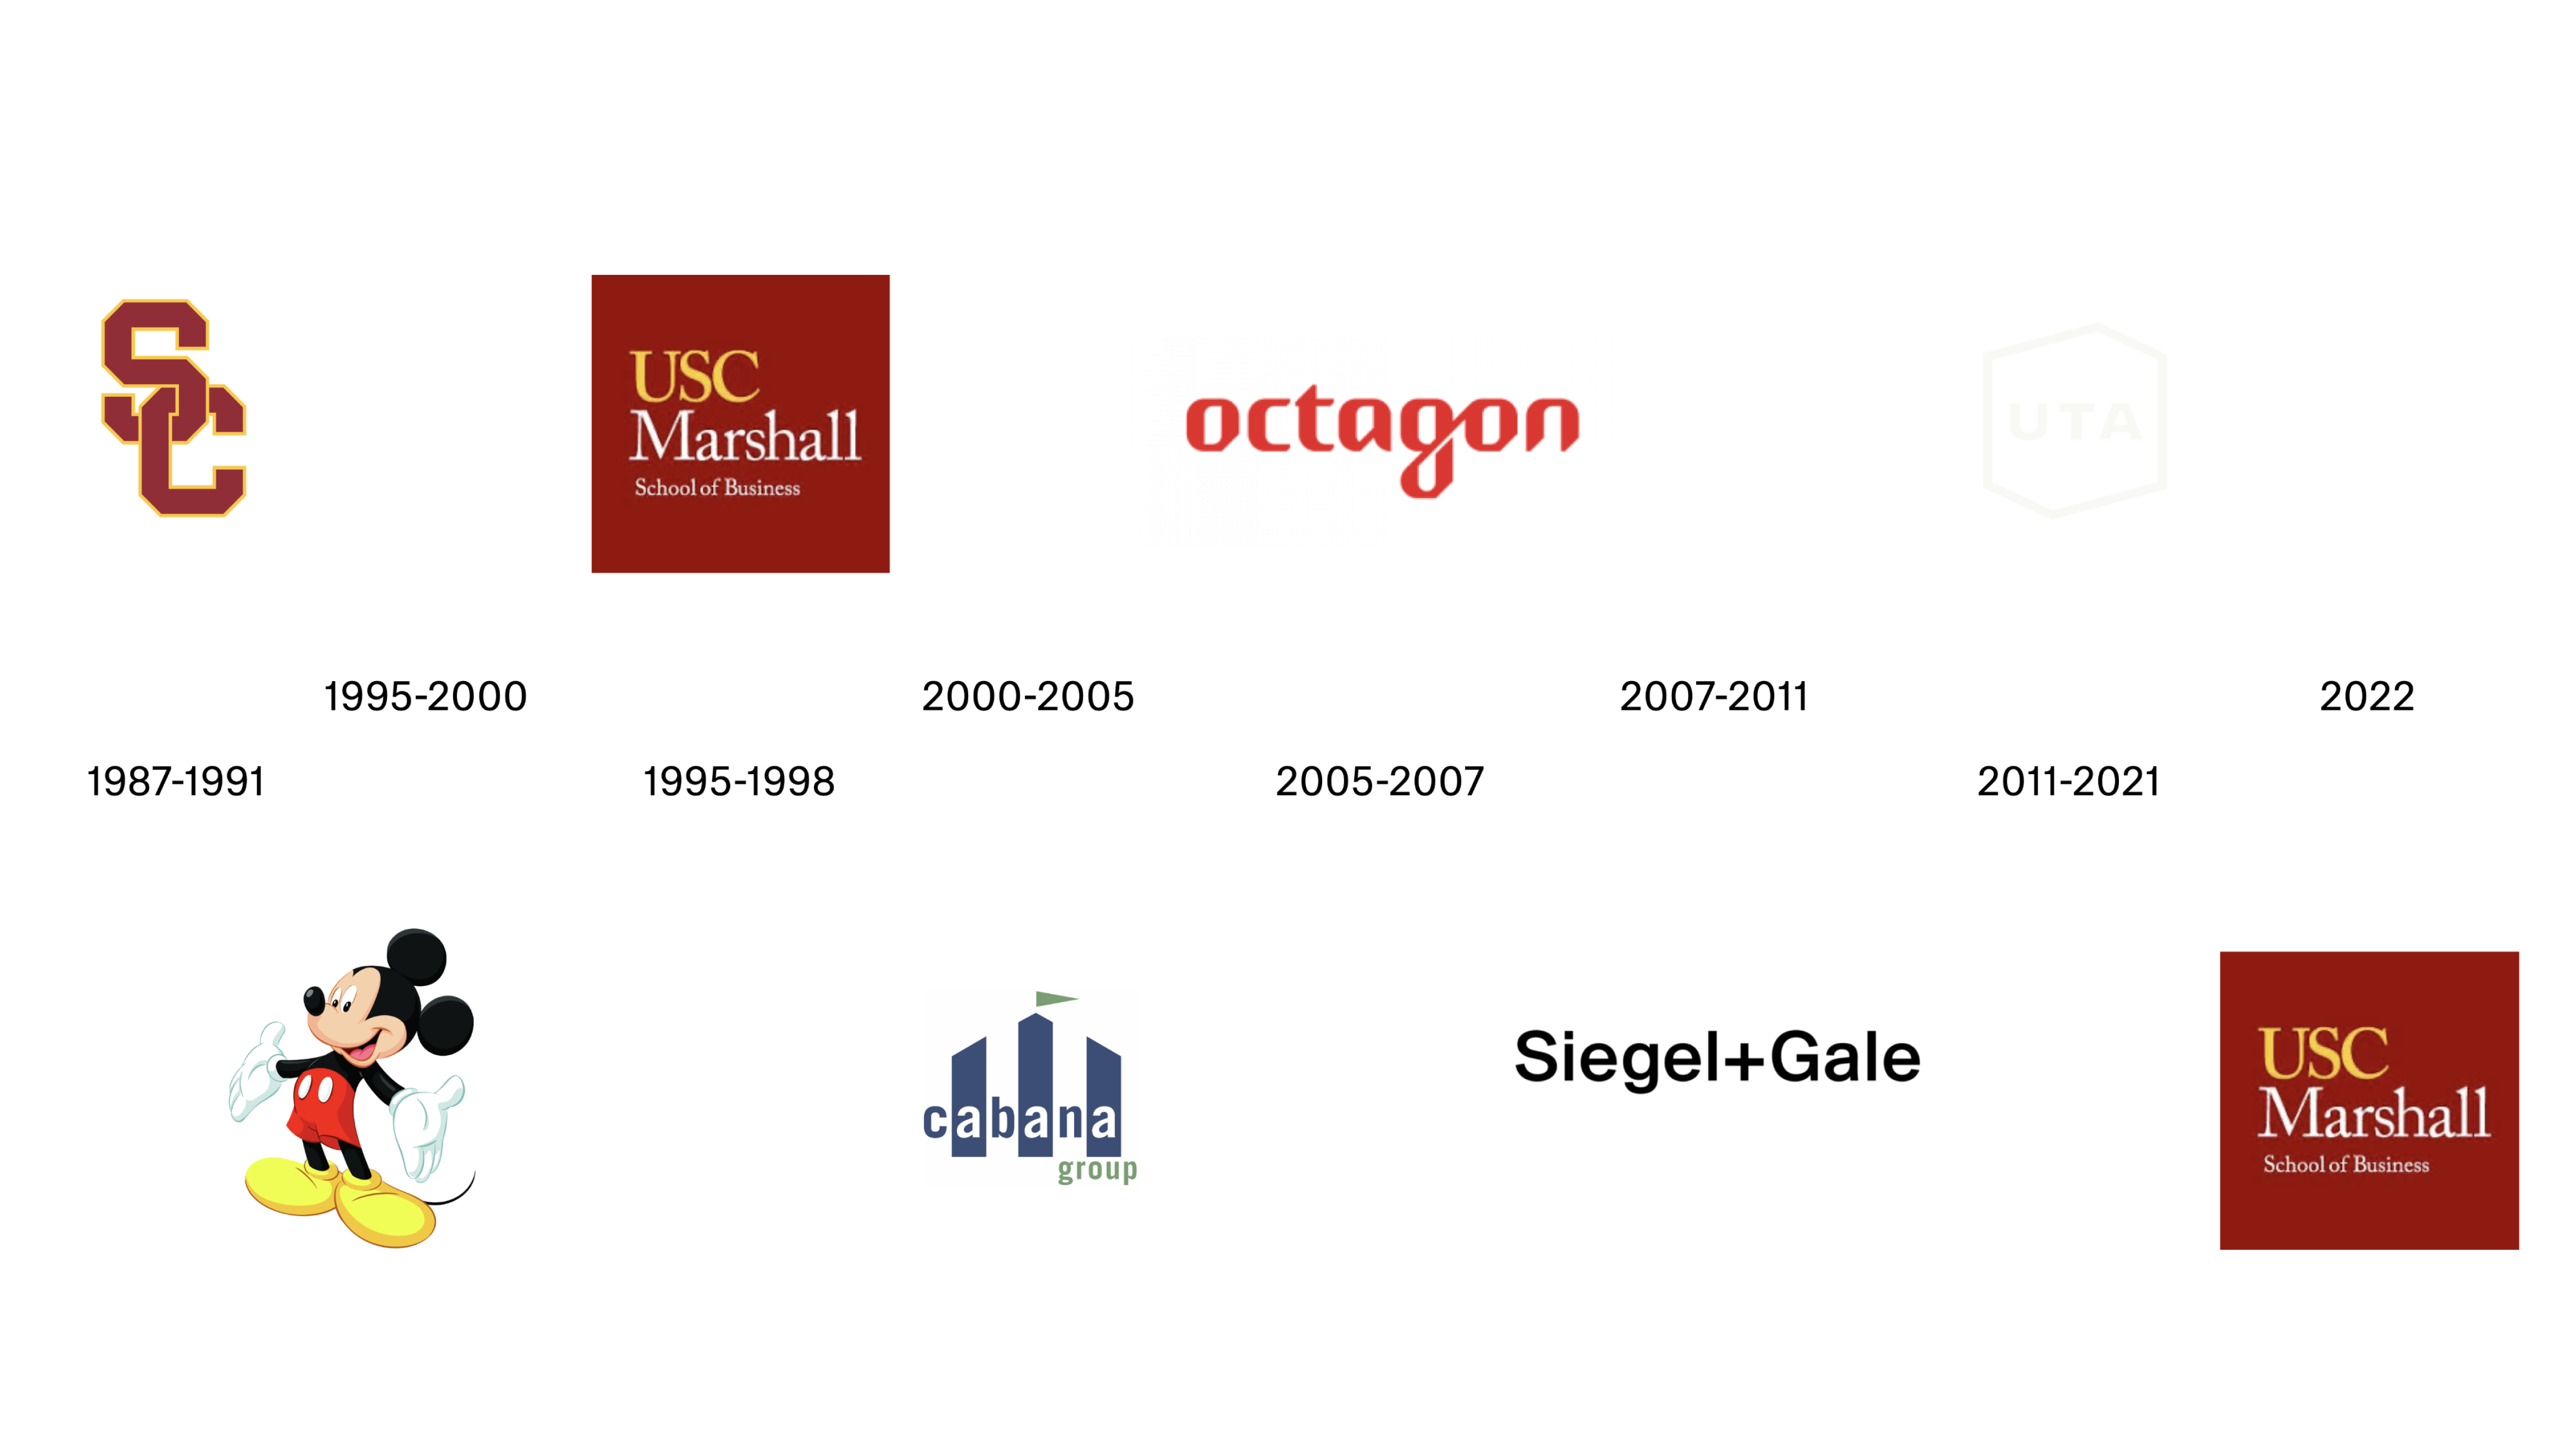
My Journey
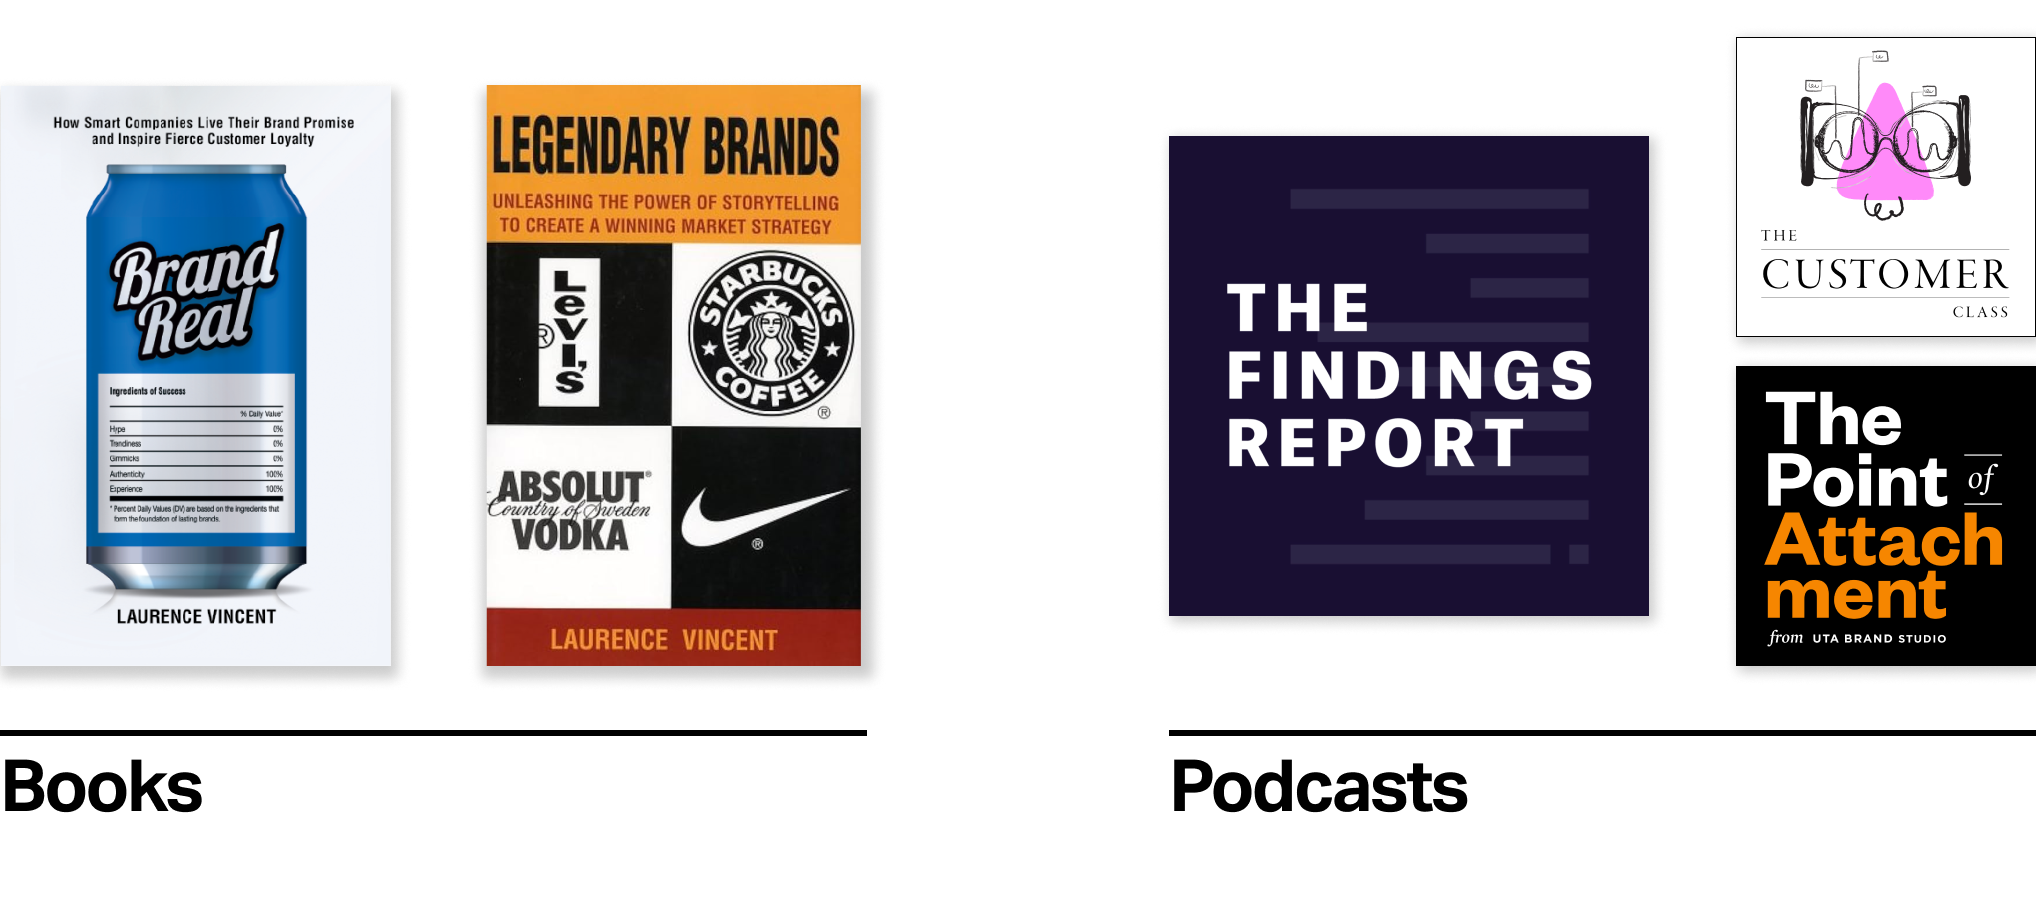
My books and podcasts
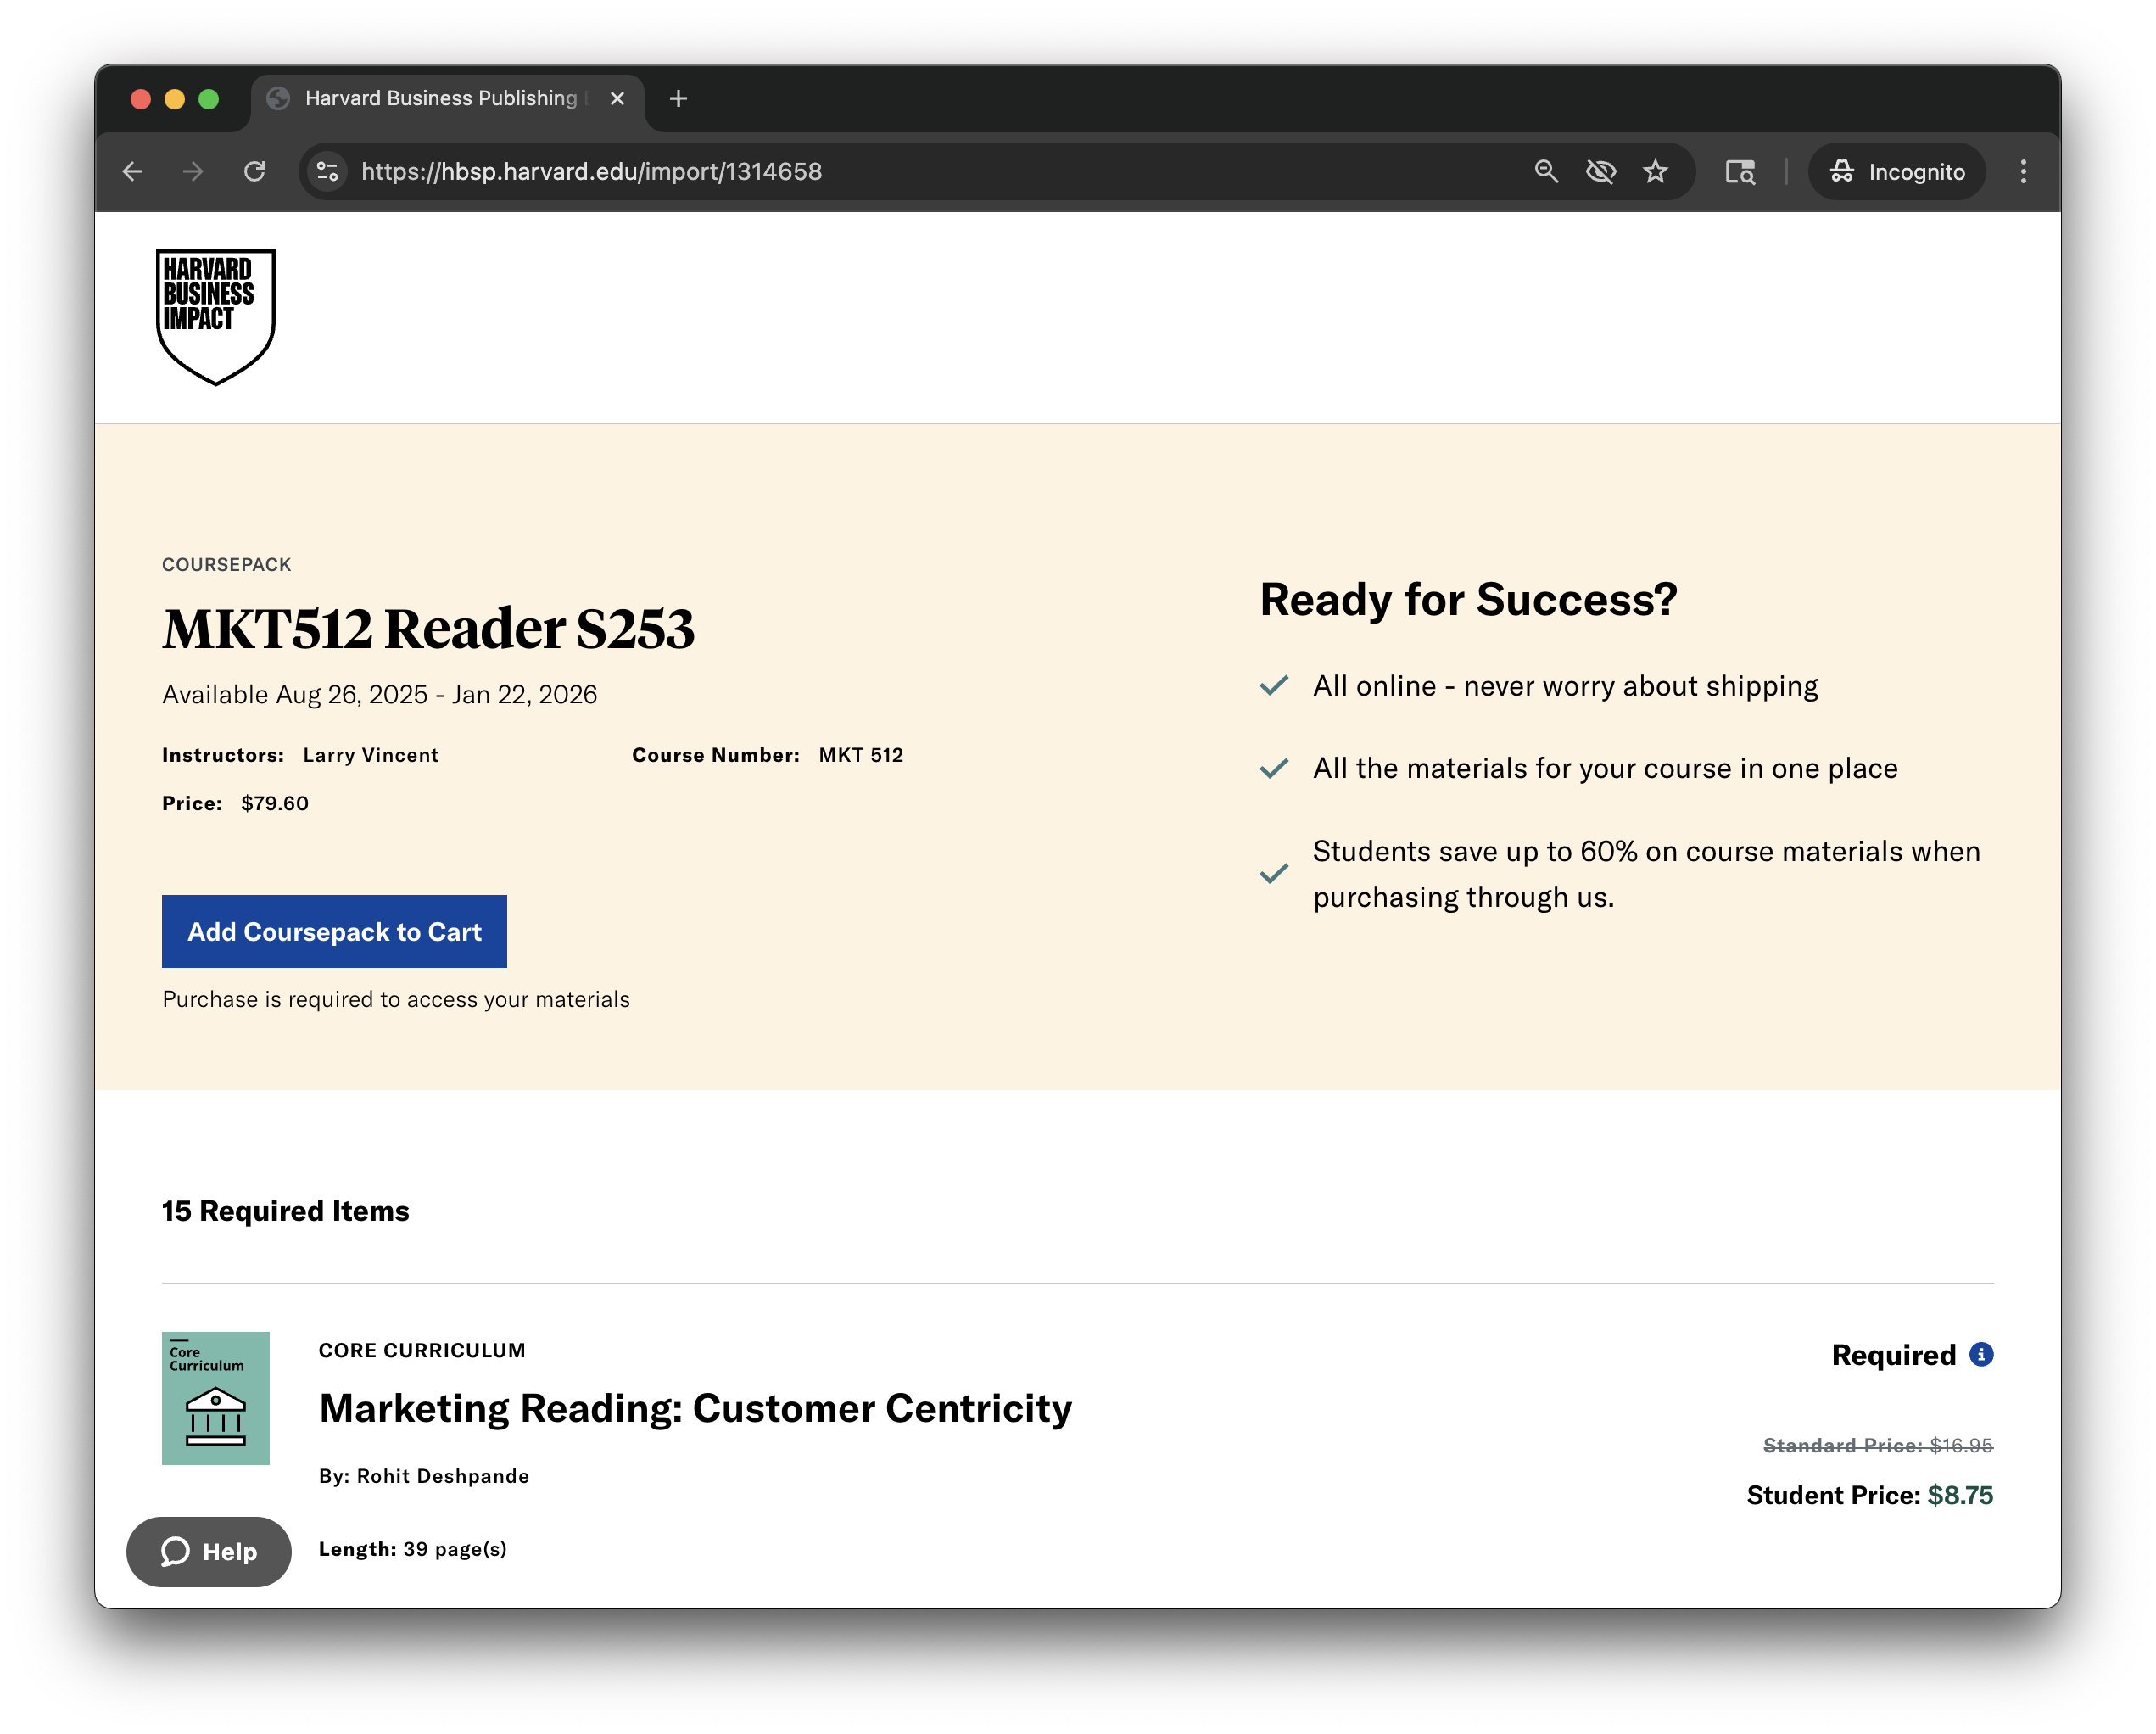
Course Reader
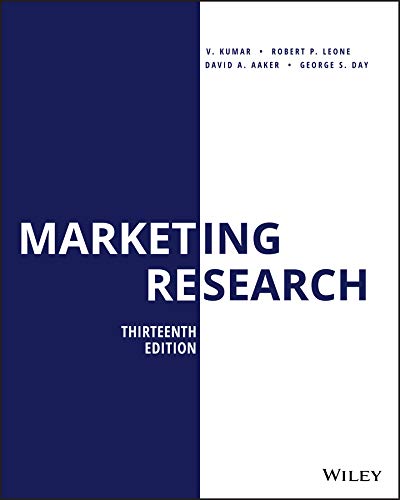
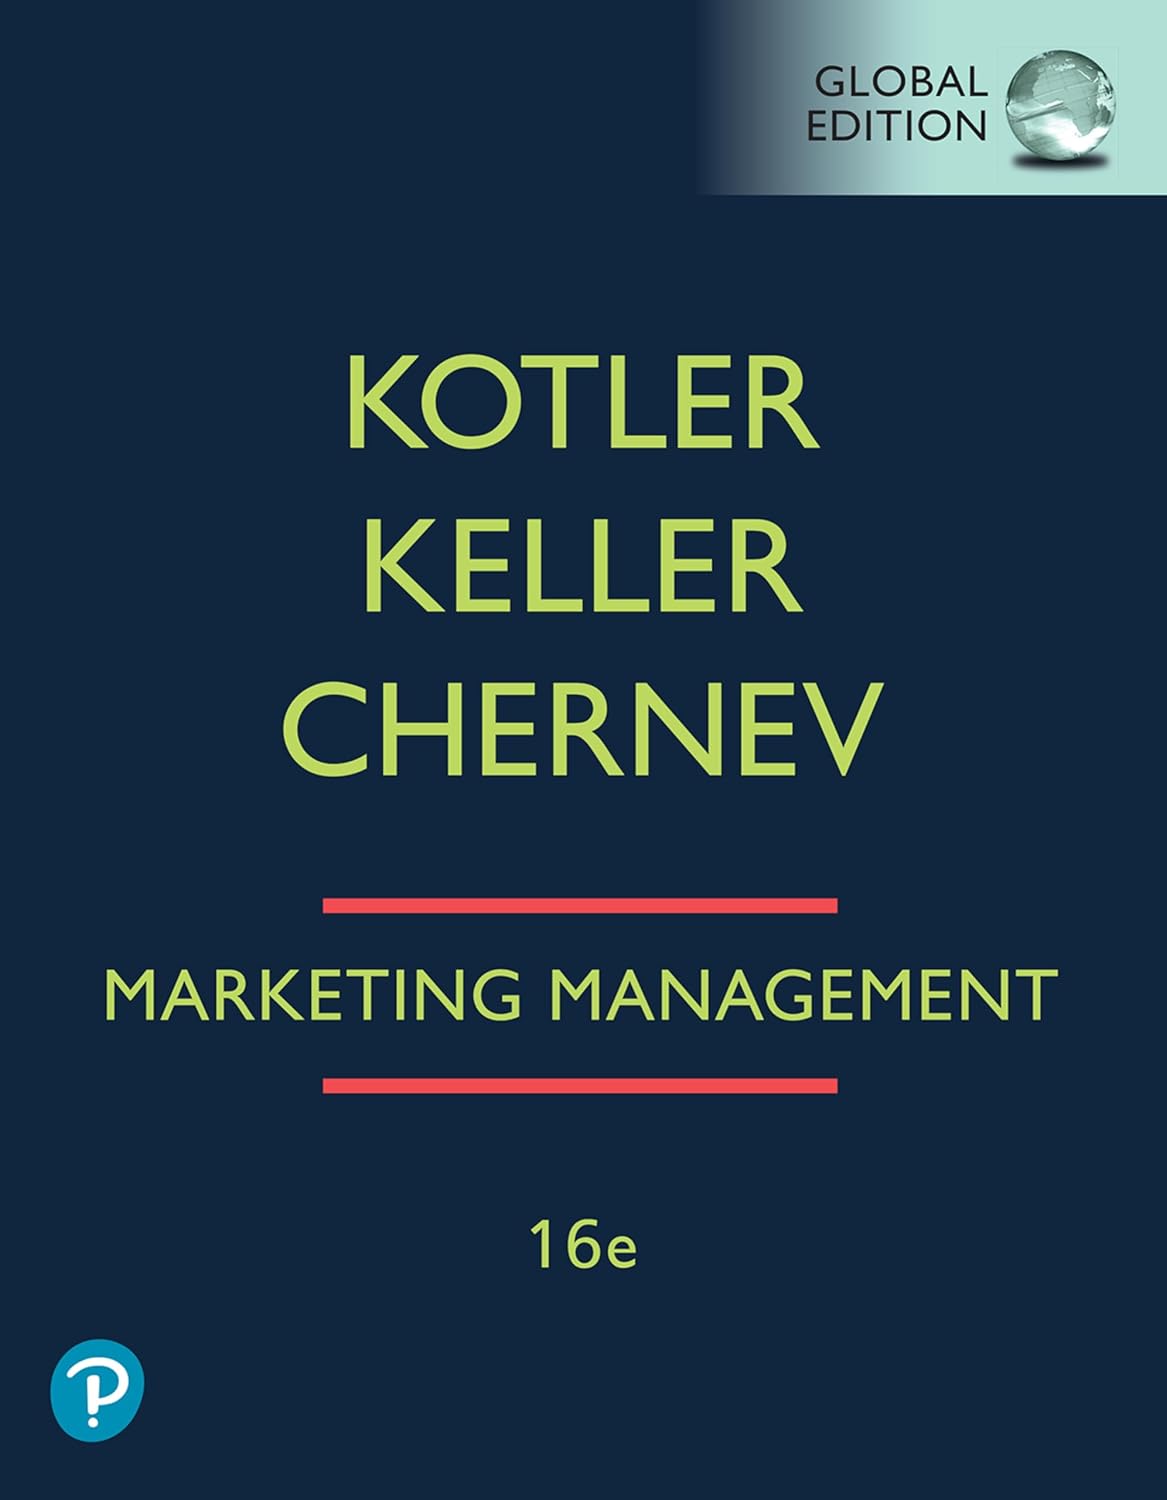
Optional Reading
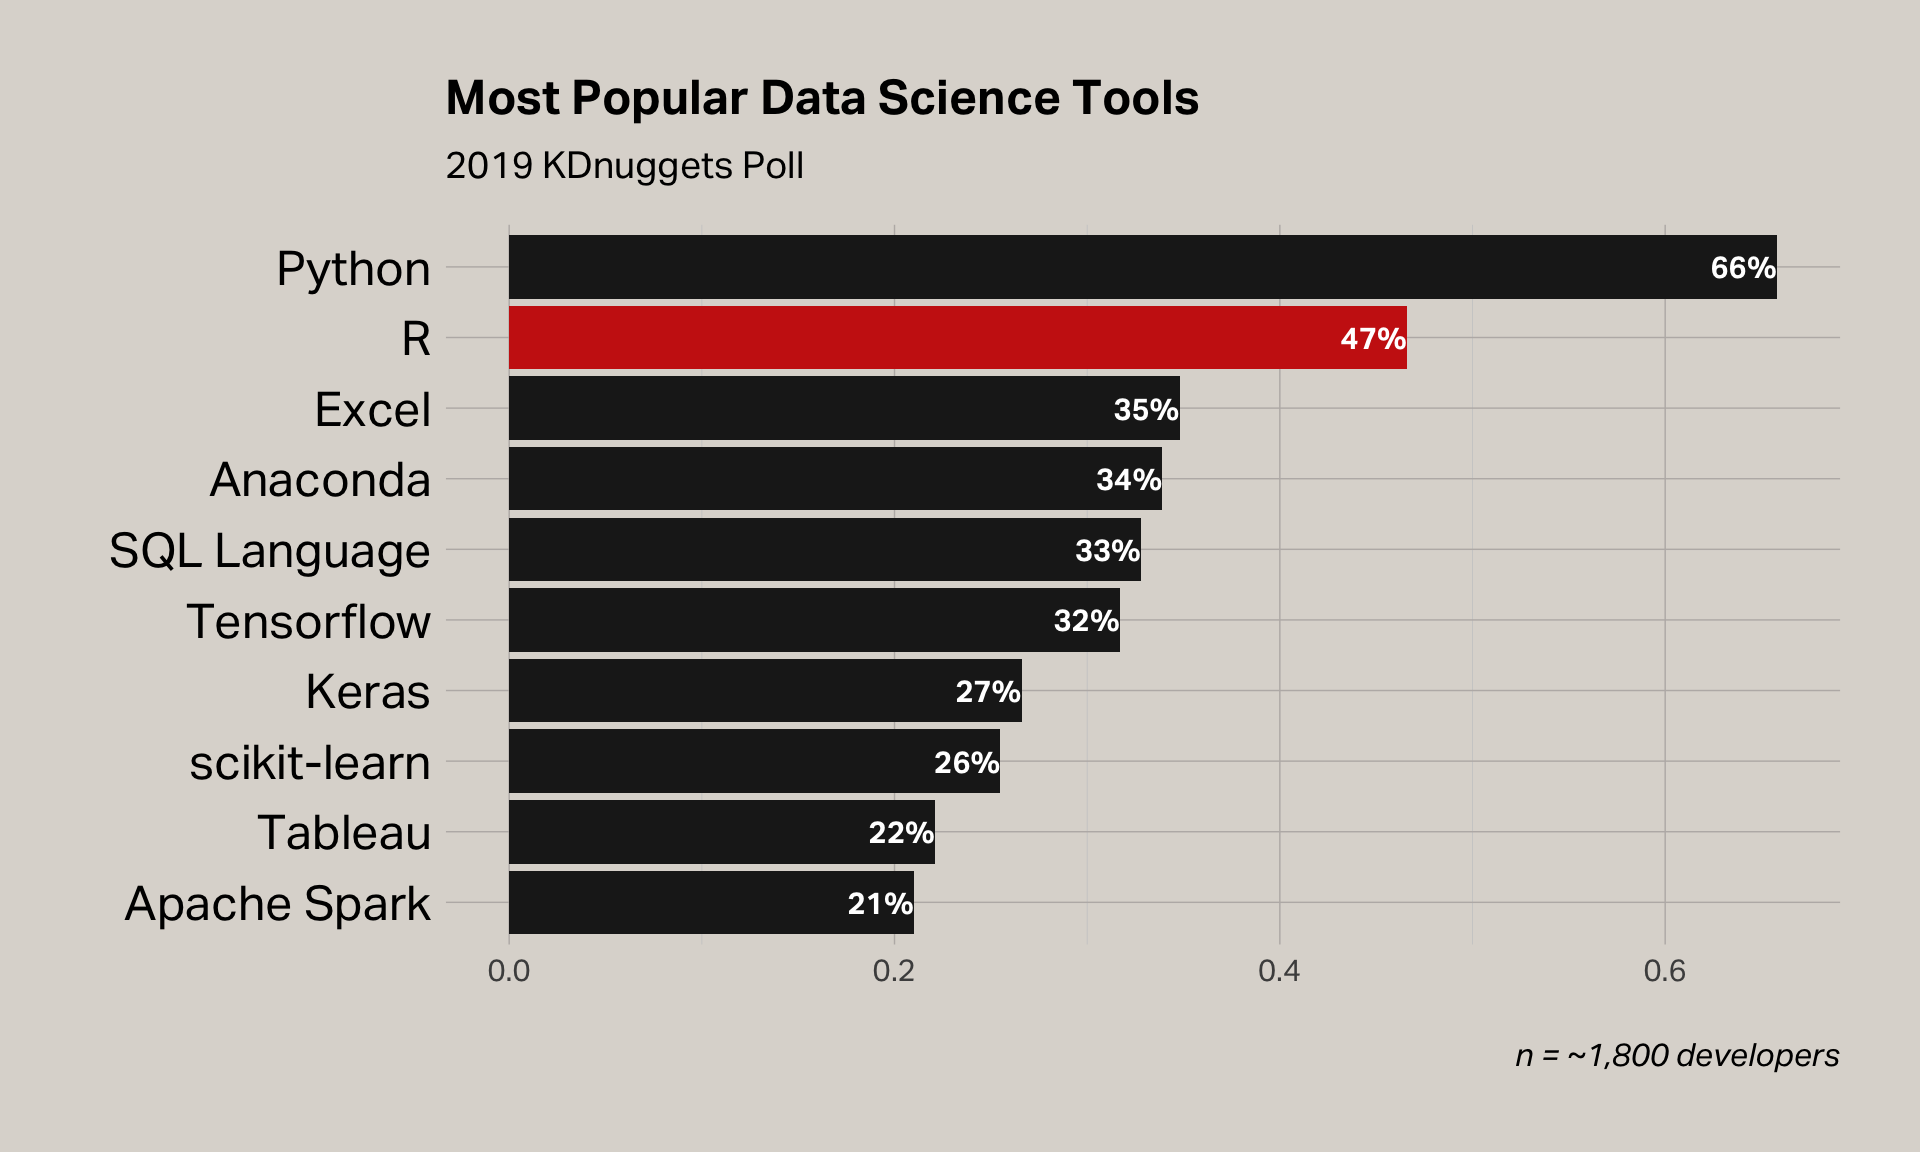
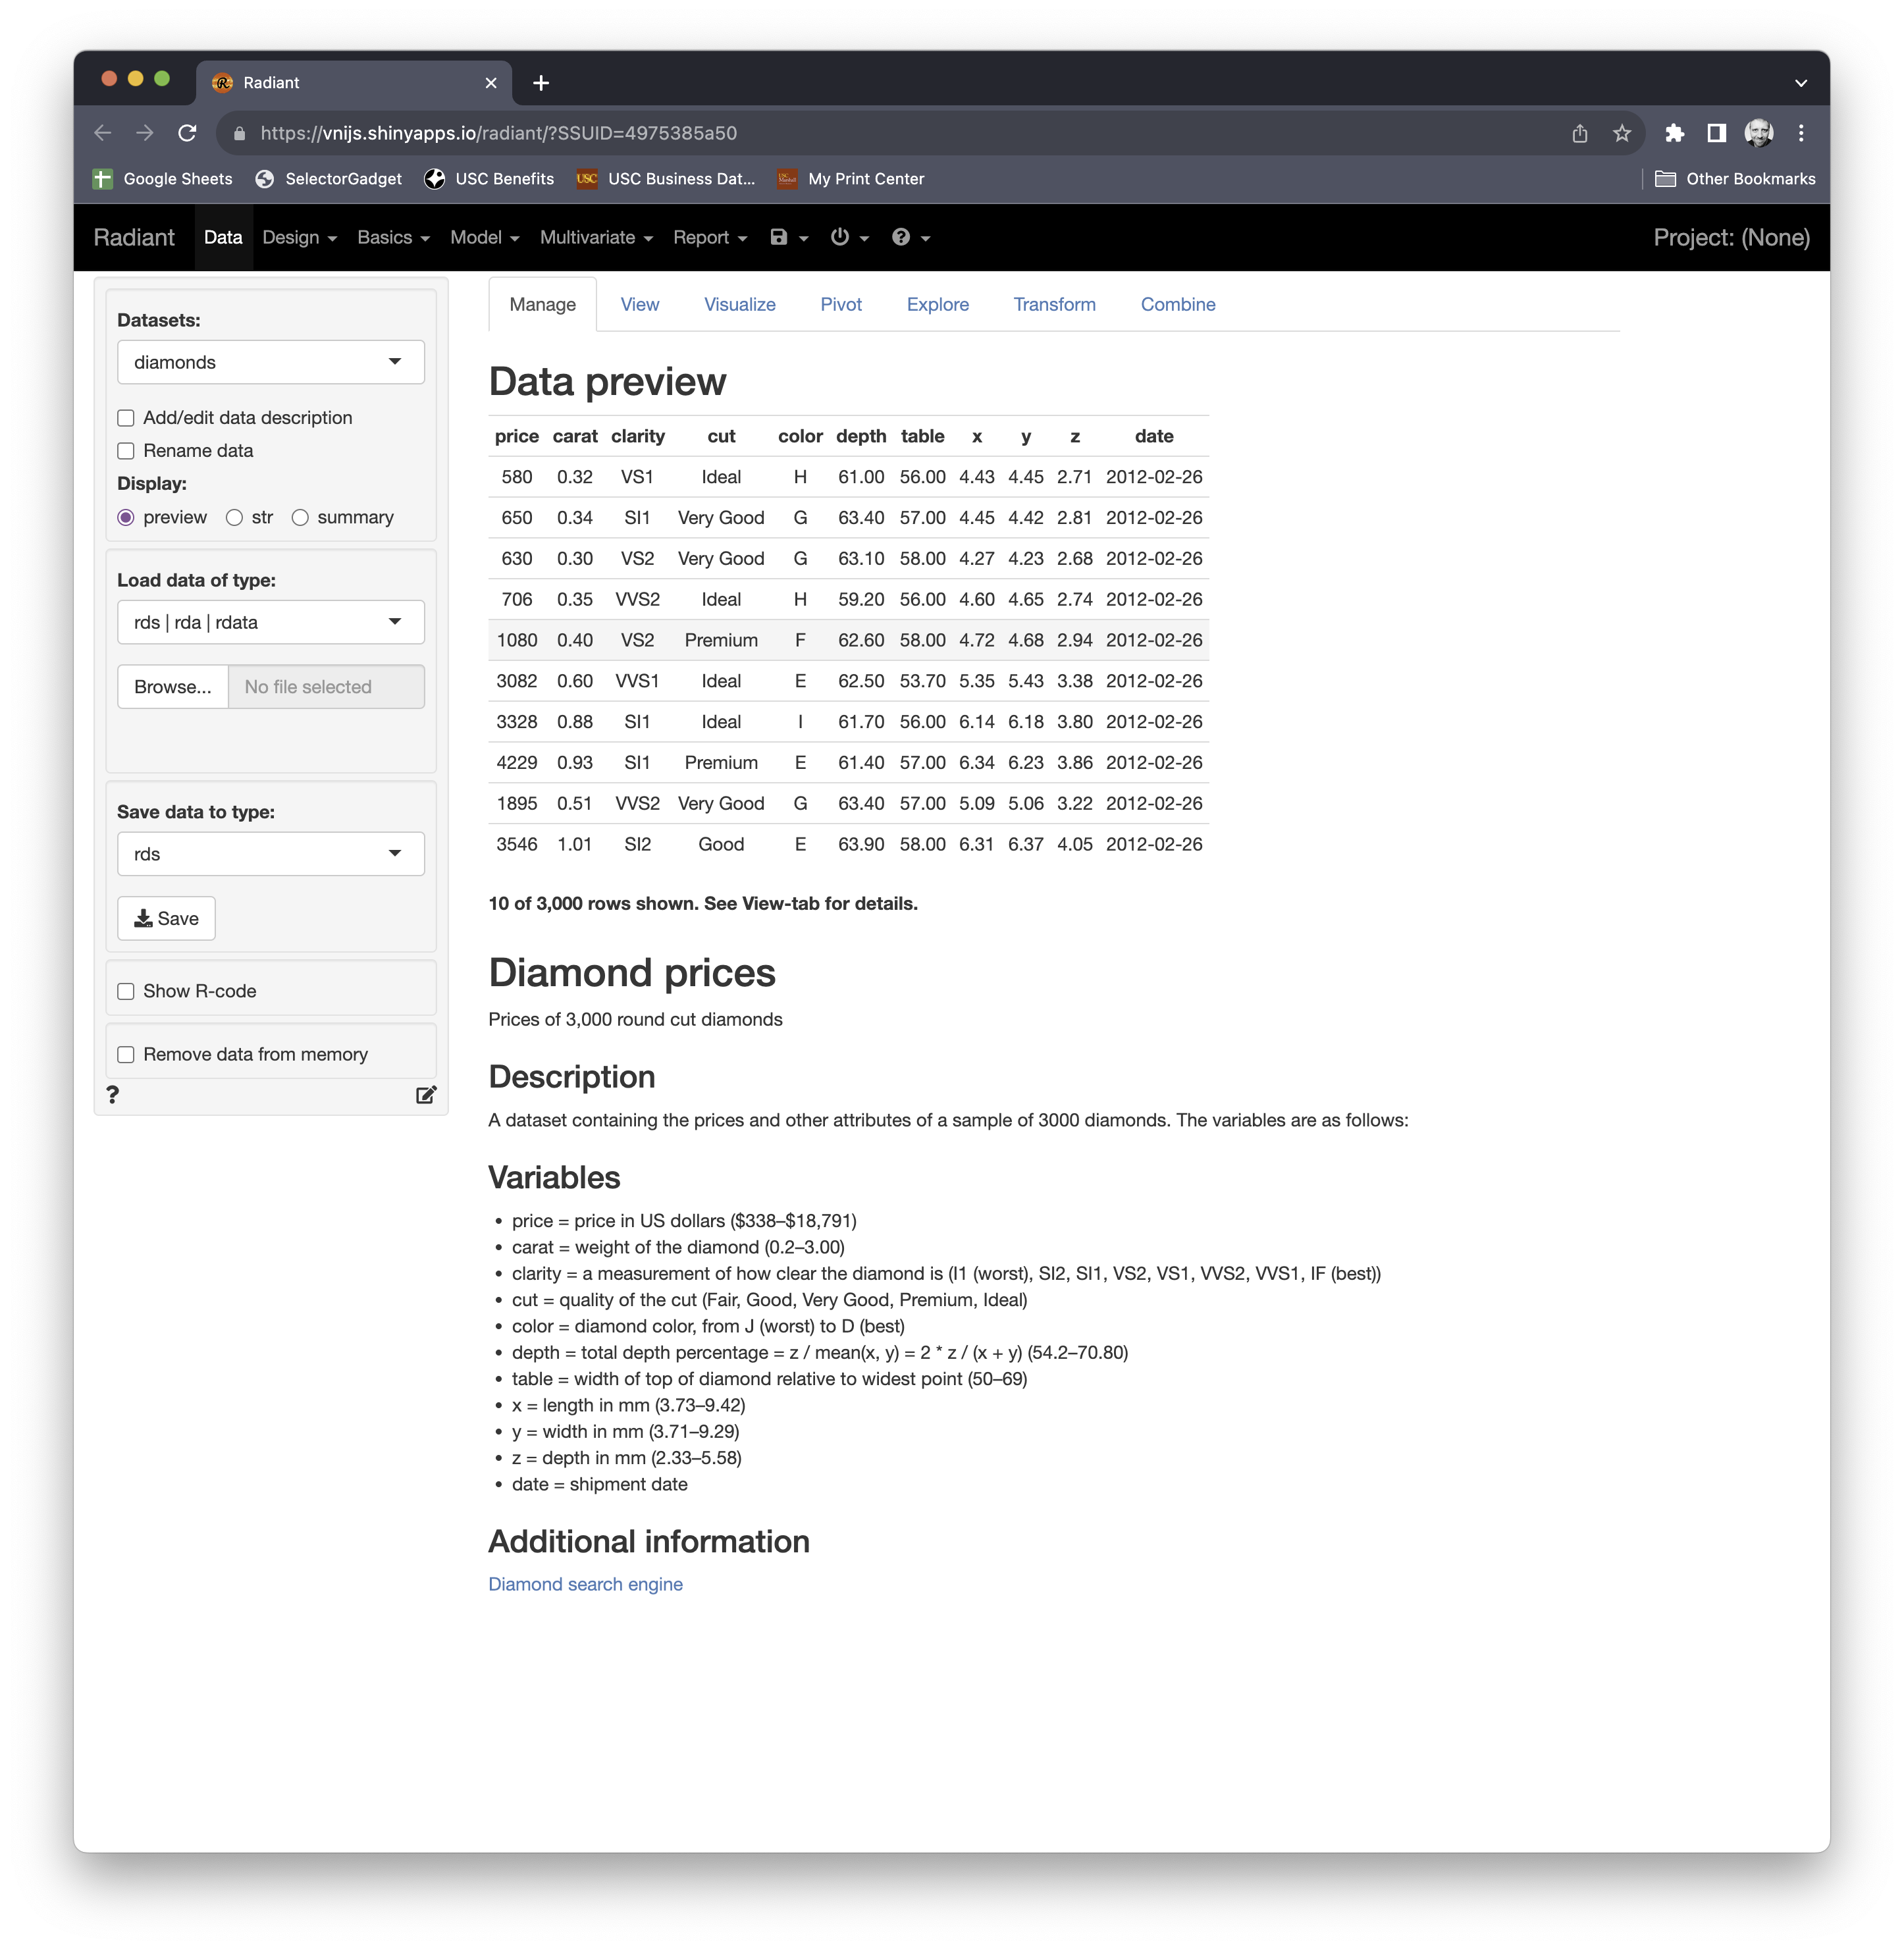
Radiant
Radiant is an open-source platform-independent browser-based interface for business analytics in R.
- Used by many students
- Free
- R foundation;
user-friendly
Grade Composition
Seating
A seating chart will be circulated at the next class. Once you choose a seat, please sit in the same assigned seat for all classes. Seats are assigned so that…
- I can learn your names quickly.
- We can credit you for attendance.
- We can ensure you get credit for participation.

The Brief
![]()
Mission
Redesign a sustainable public-media membership model for a post-broadcast world
The problem
KCRW’s membership pipeline is dependent on legacy broadcast patterns (pledge drives, linear listening habits). Digital audiences listen but don’t convert to membership.
The prompt
If you were starting from zero today—no broadcast legacy—how would you design a membership program that authentically fits KCRW’s brand but aligns with digital consumption?
Considerations
Segmentation, pricing psychology, friction points, LTV modeling, bundling, and acquisition funnels
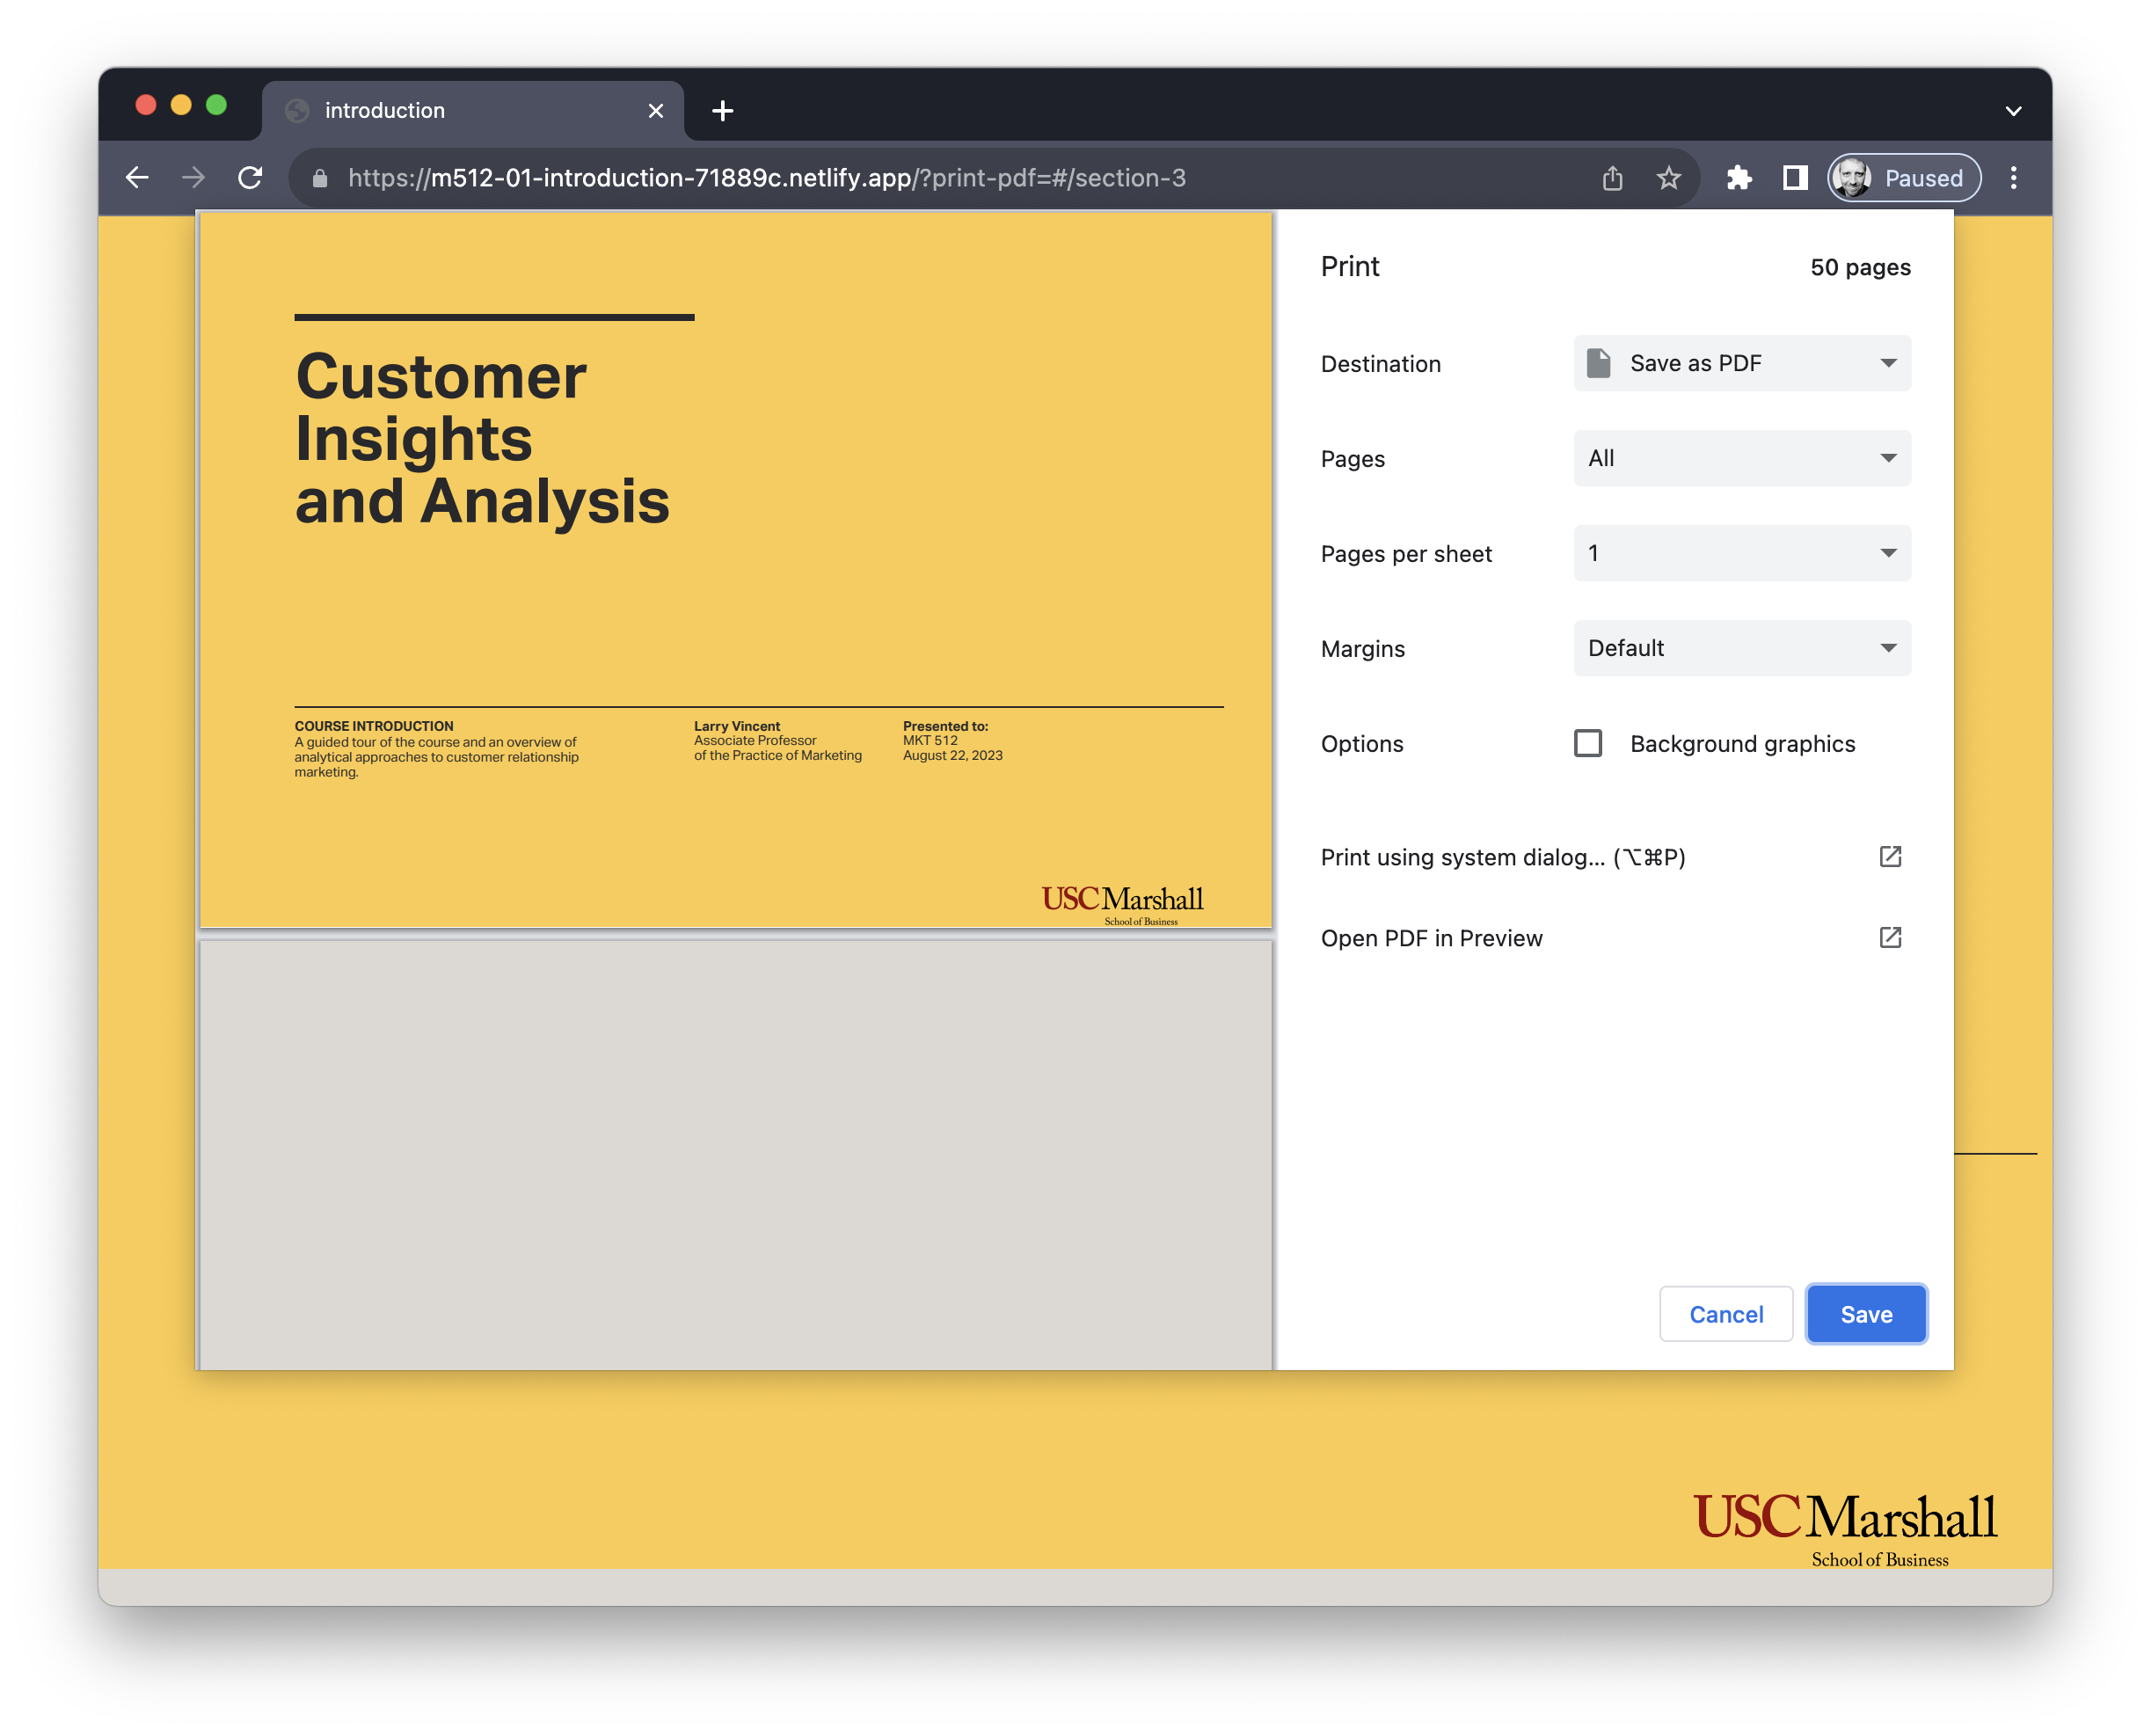
Creating slide deck PDFs
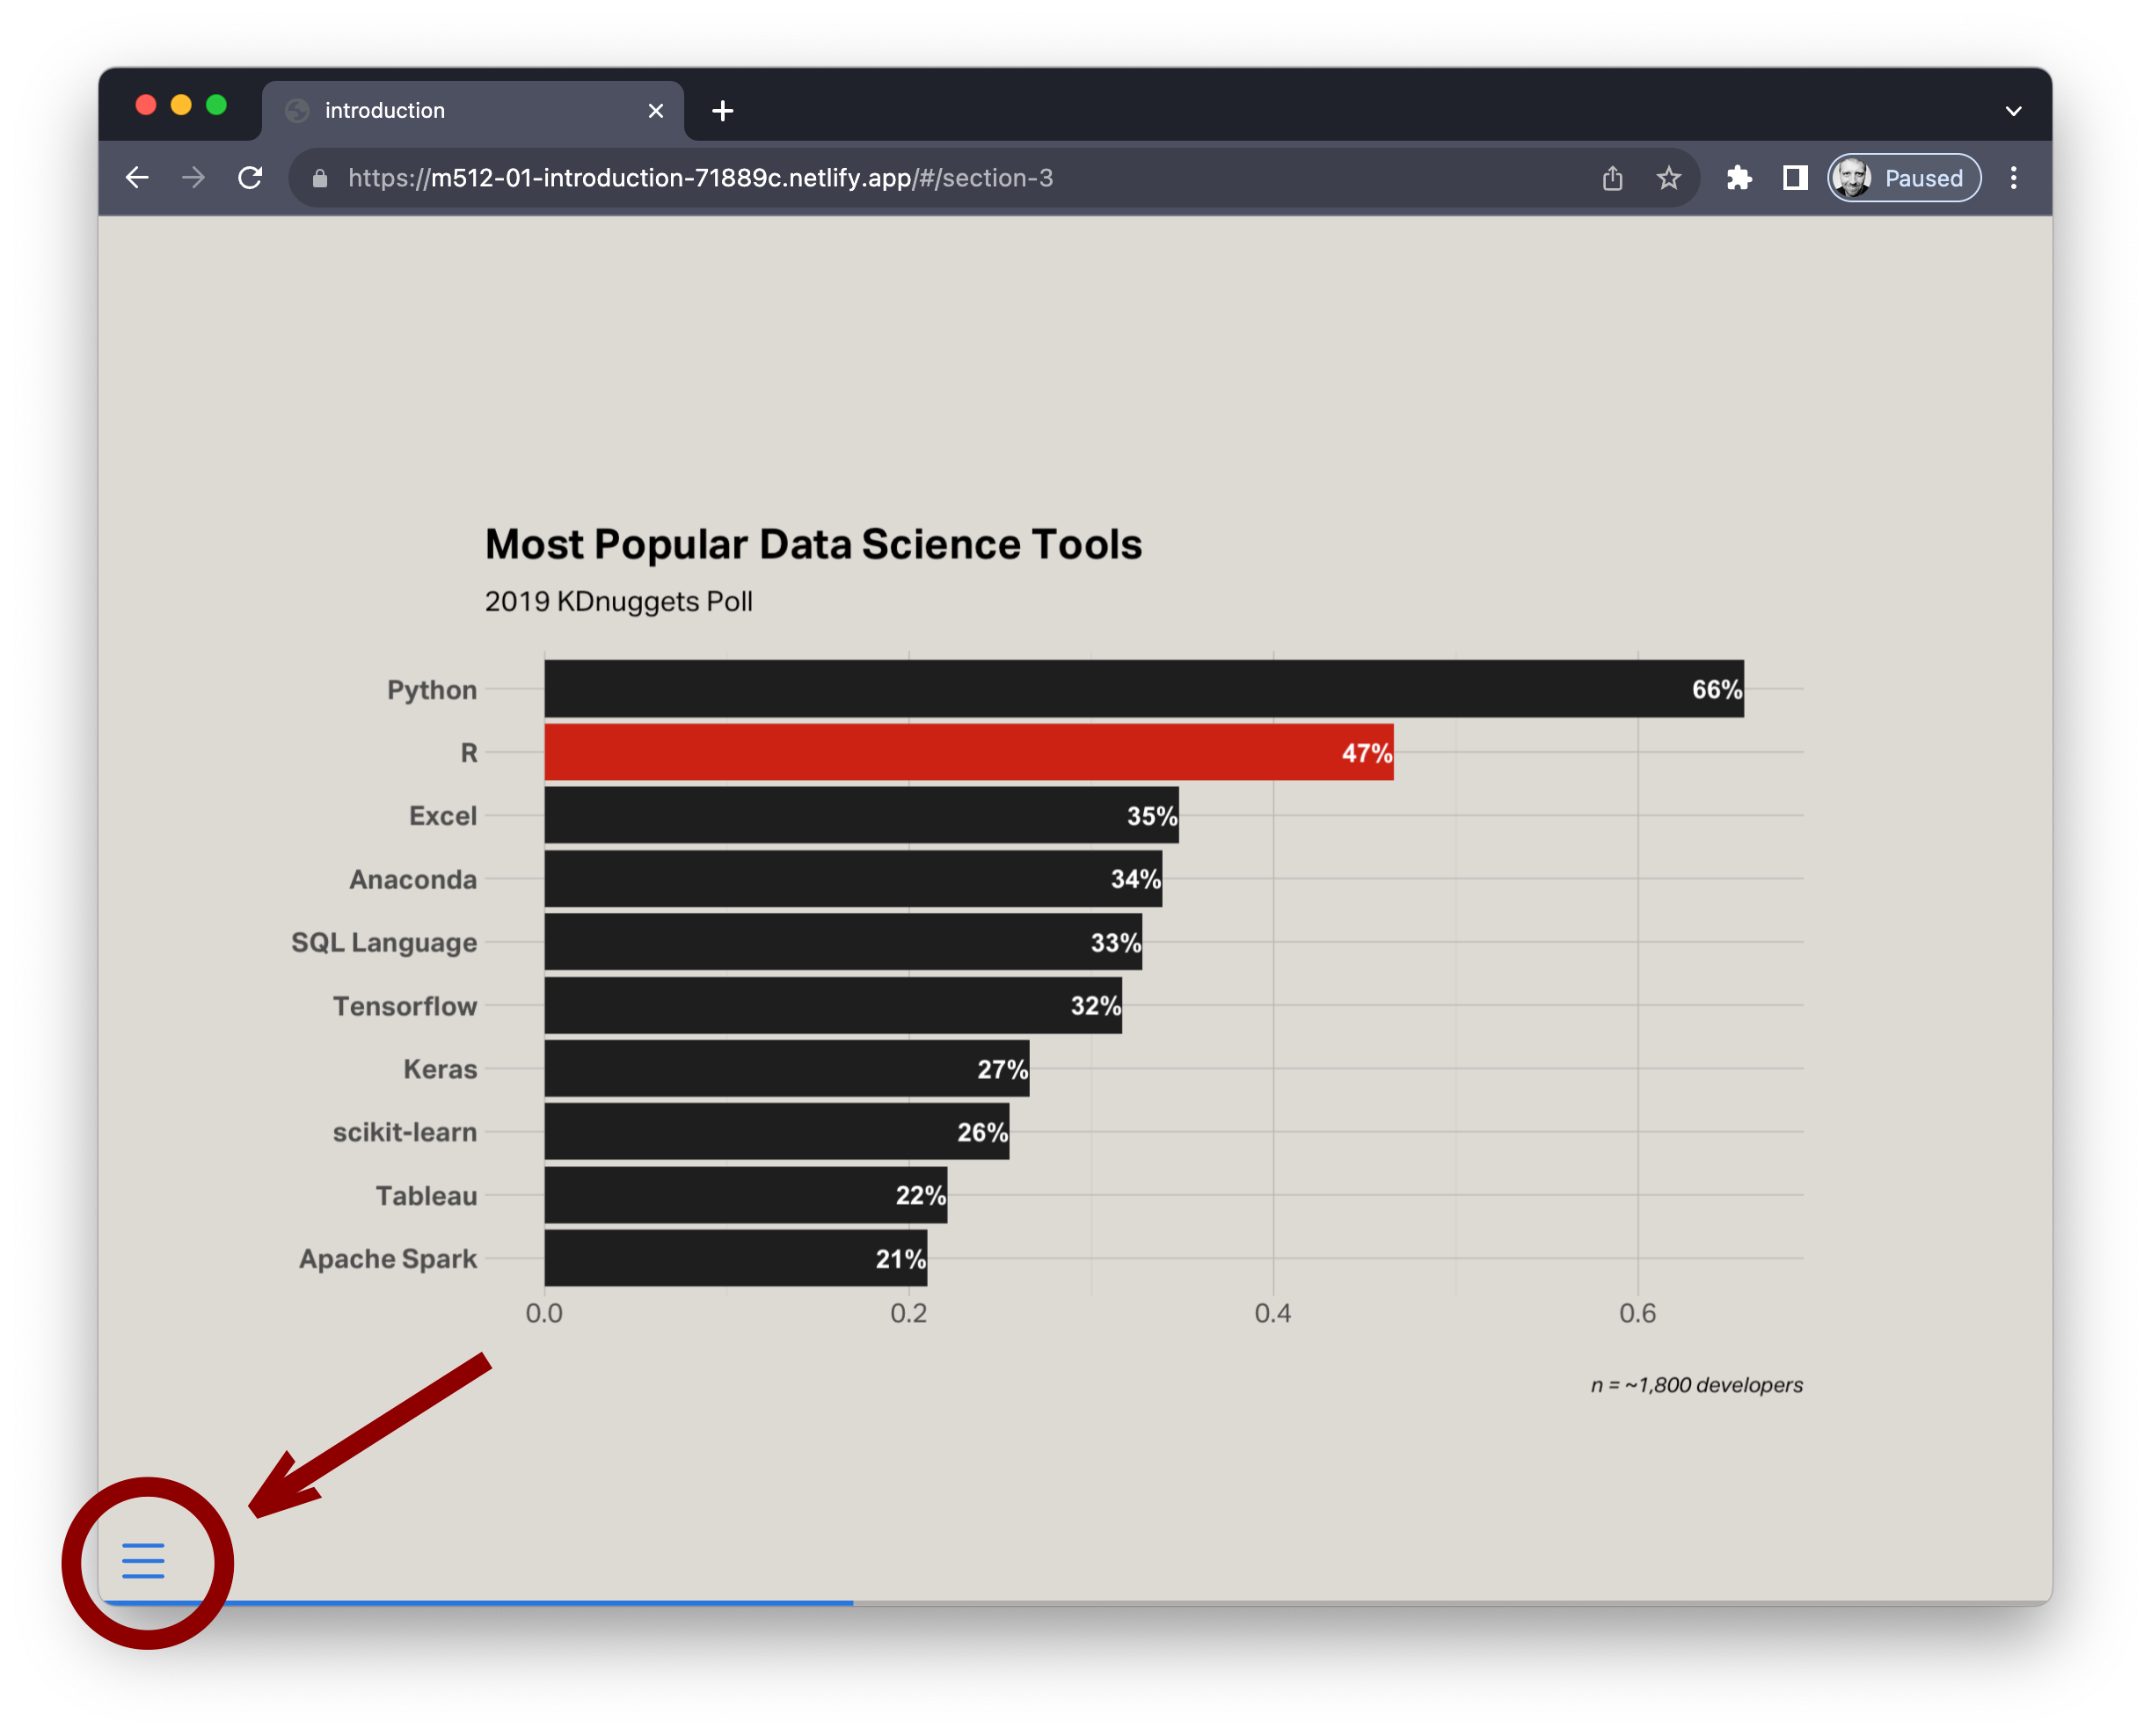
Creating slide deck PDFs
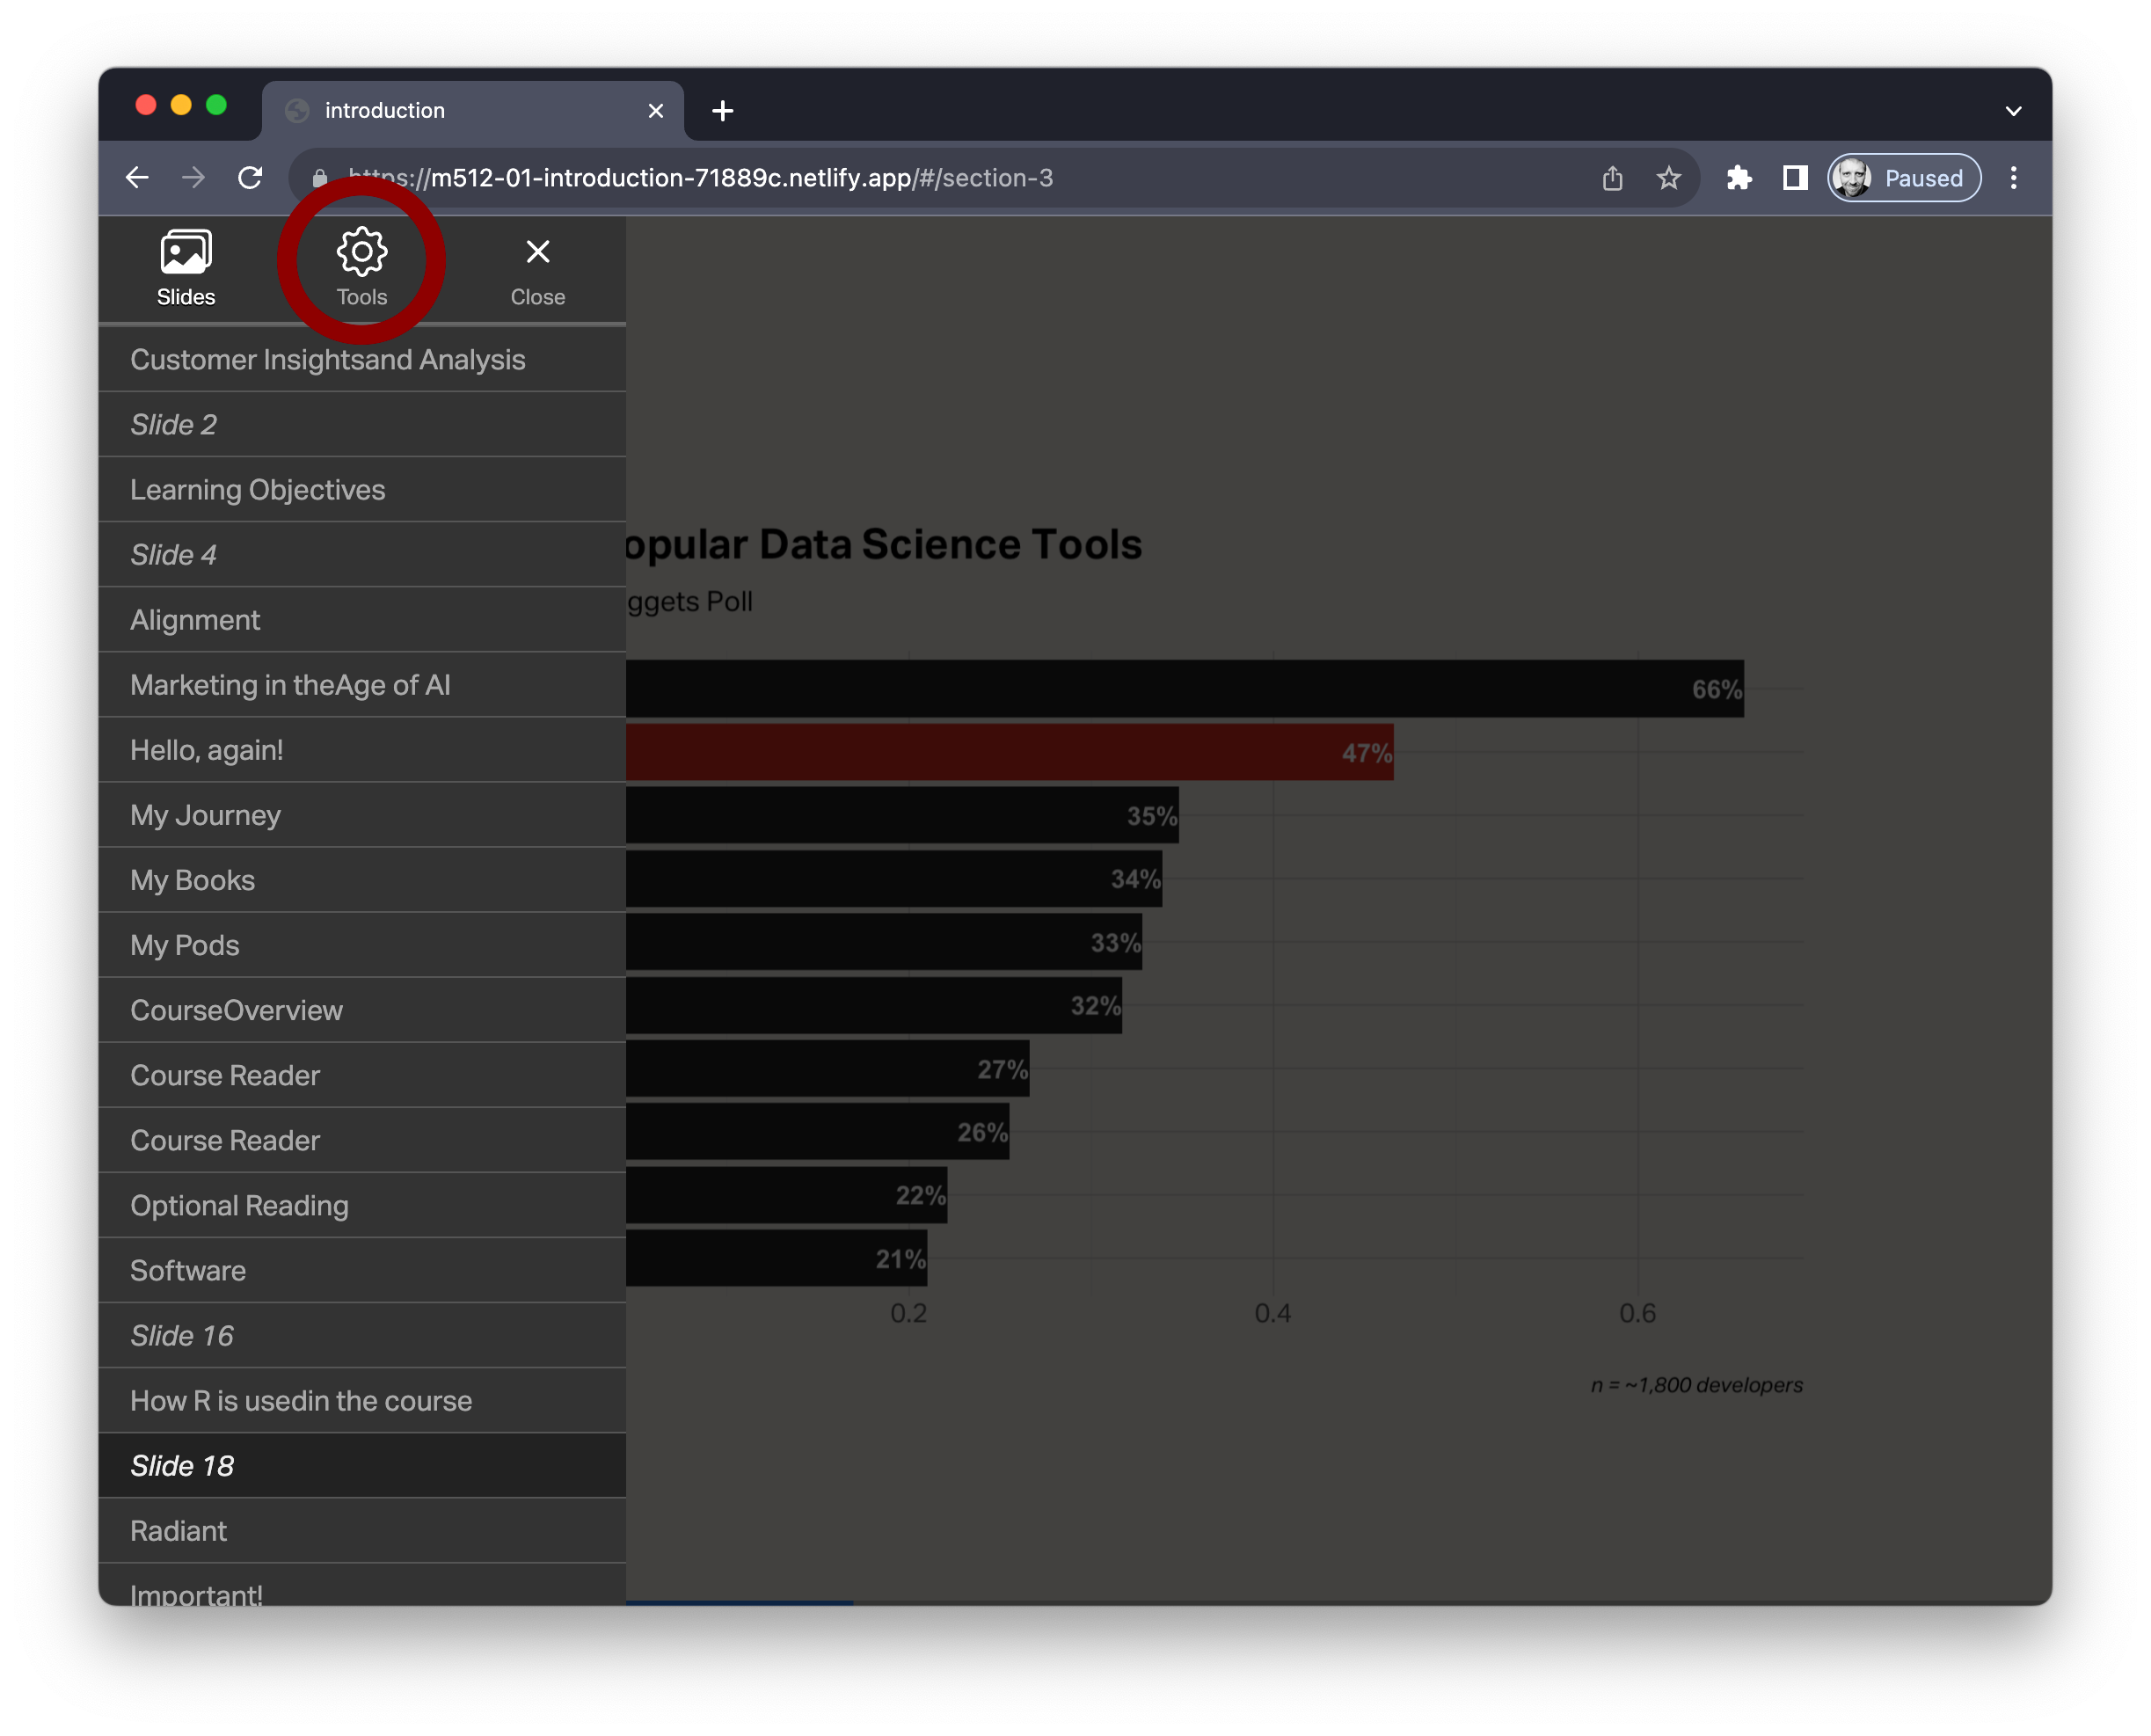
Creating slide deck PDFs
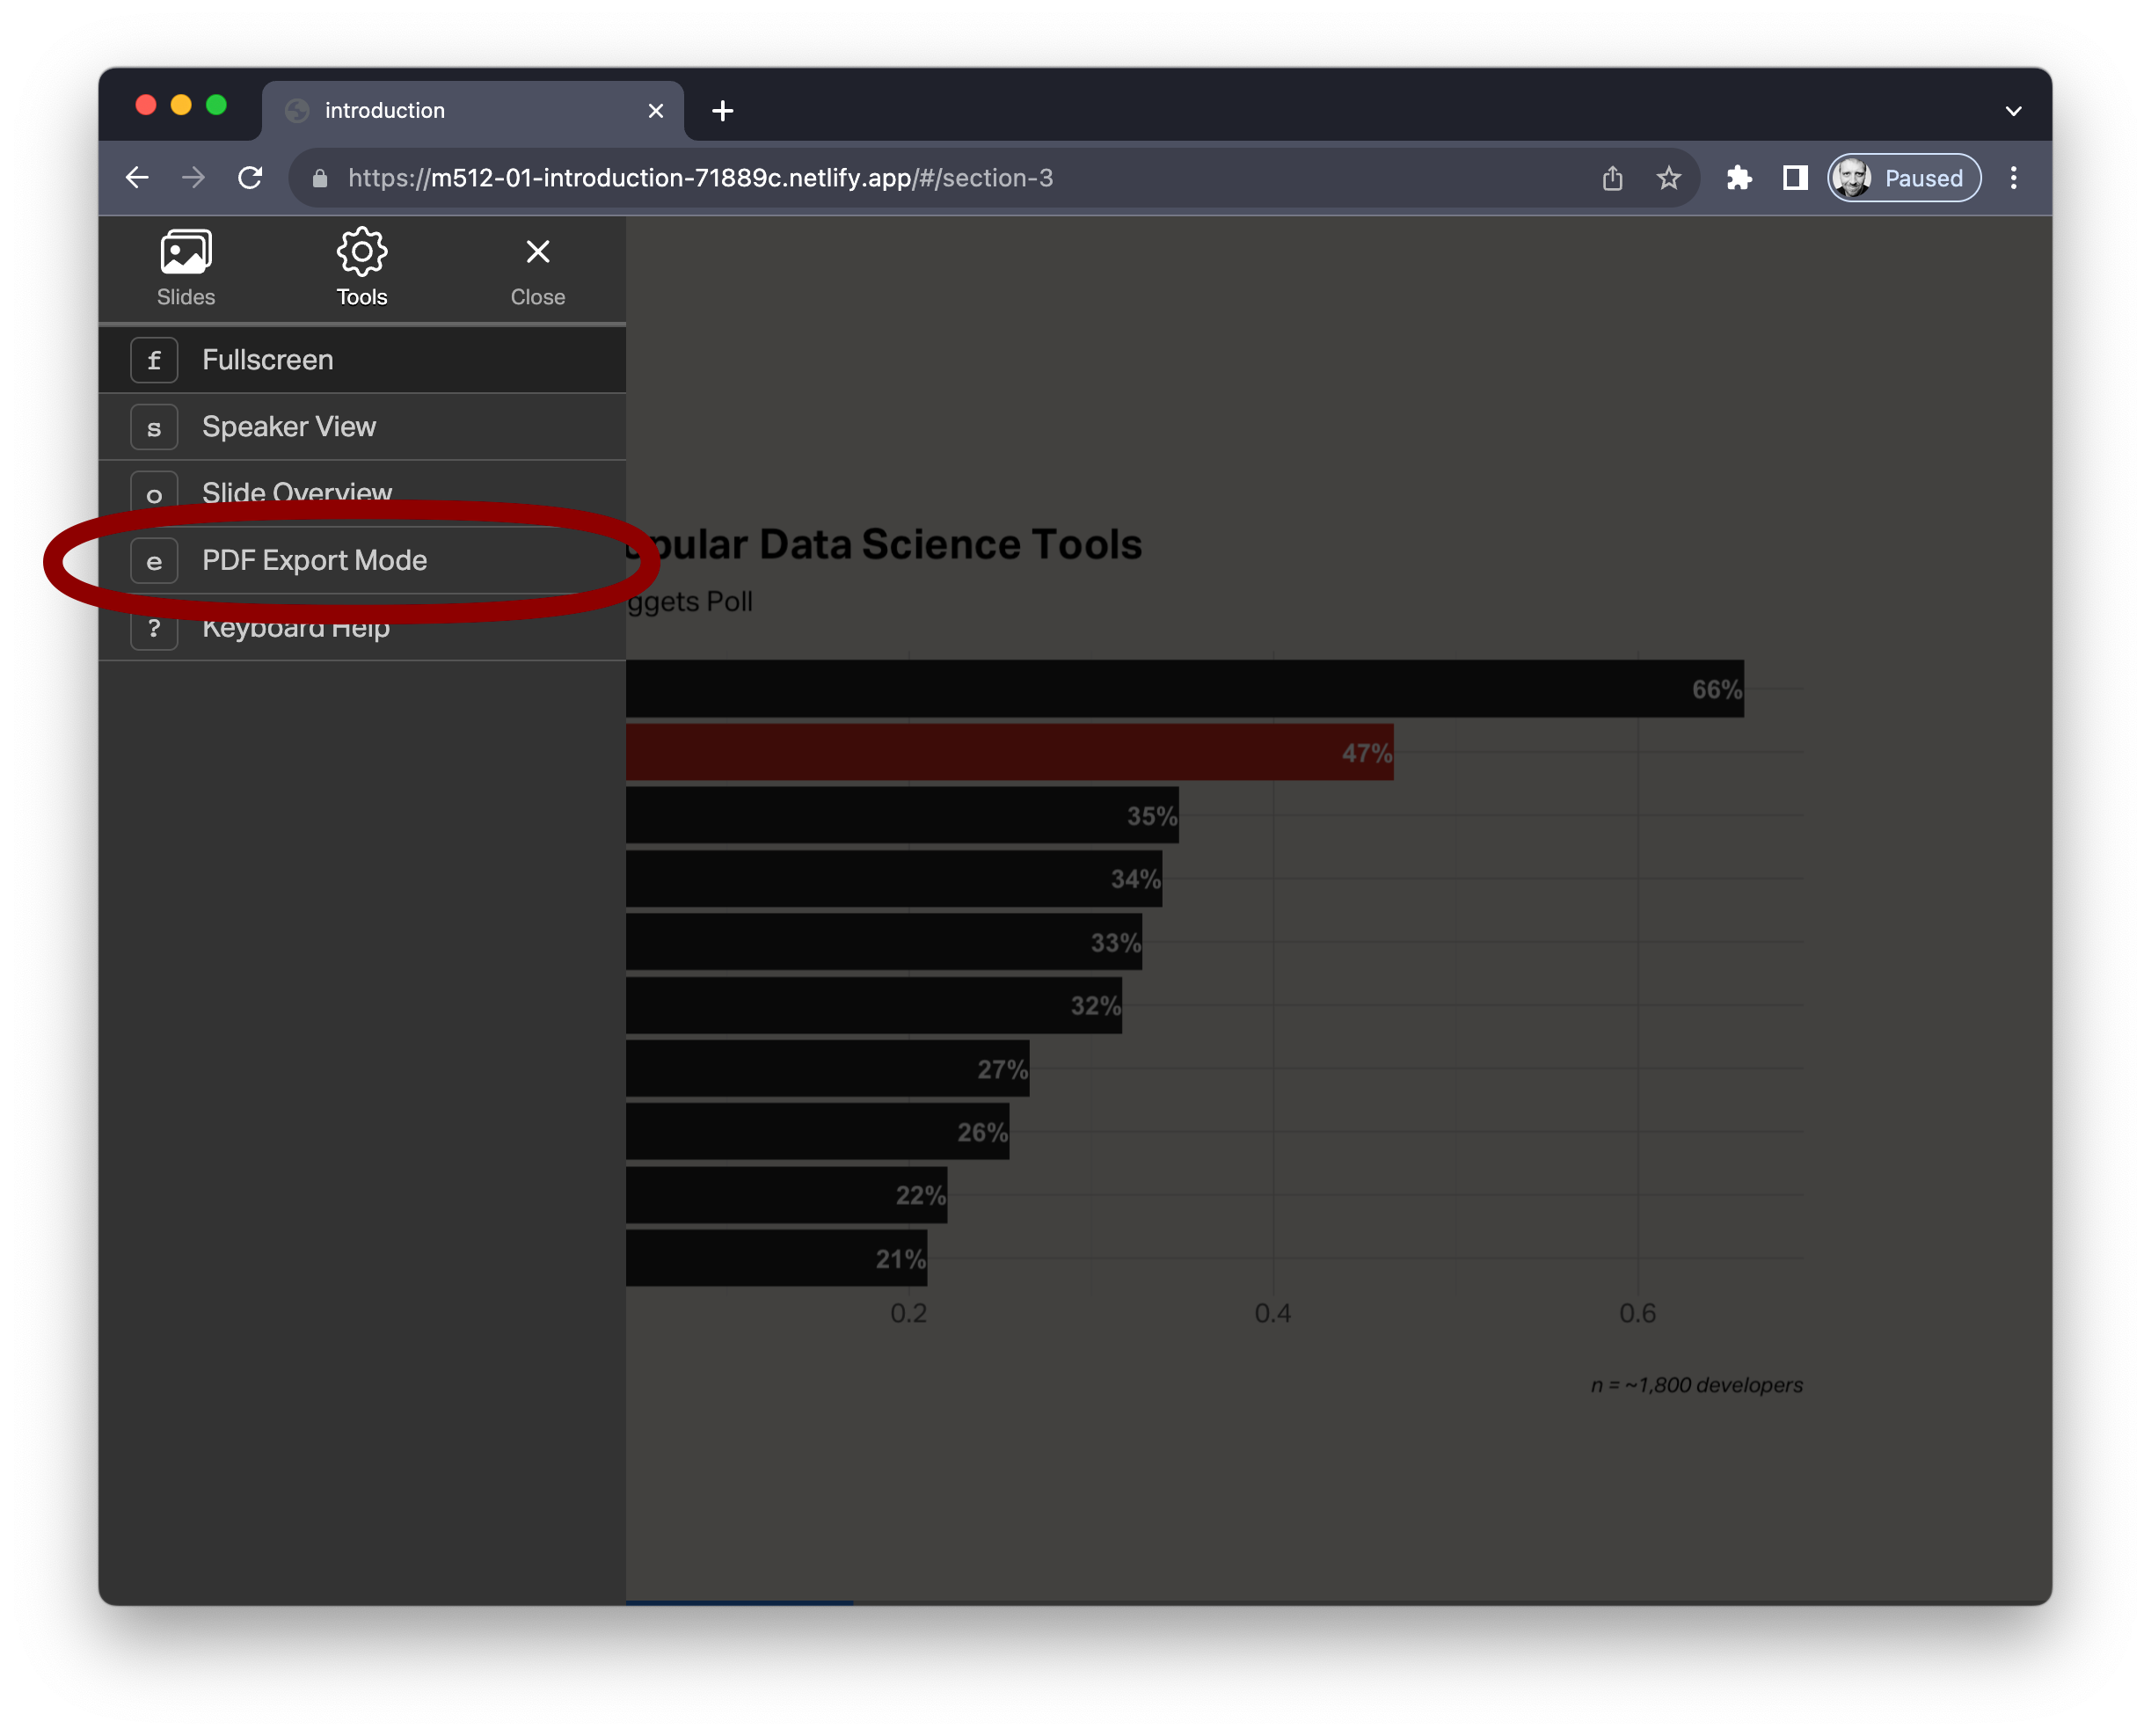
Creating slide deck PDFs
Electronic Devices
The class is better when
you are fully present!

- Electronic devices MAY be used for note taking and reviewing course materials only.
- No devices during case discussions.
- If devices become distracting, I may ask you to put them away.
Marketing in the age of AI
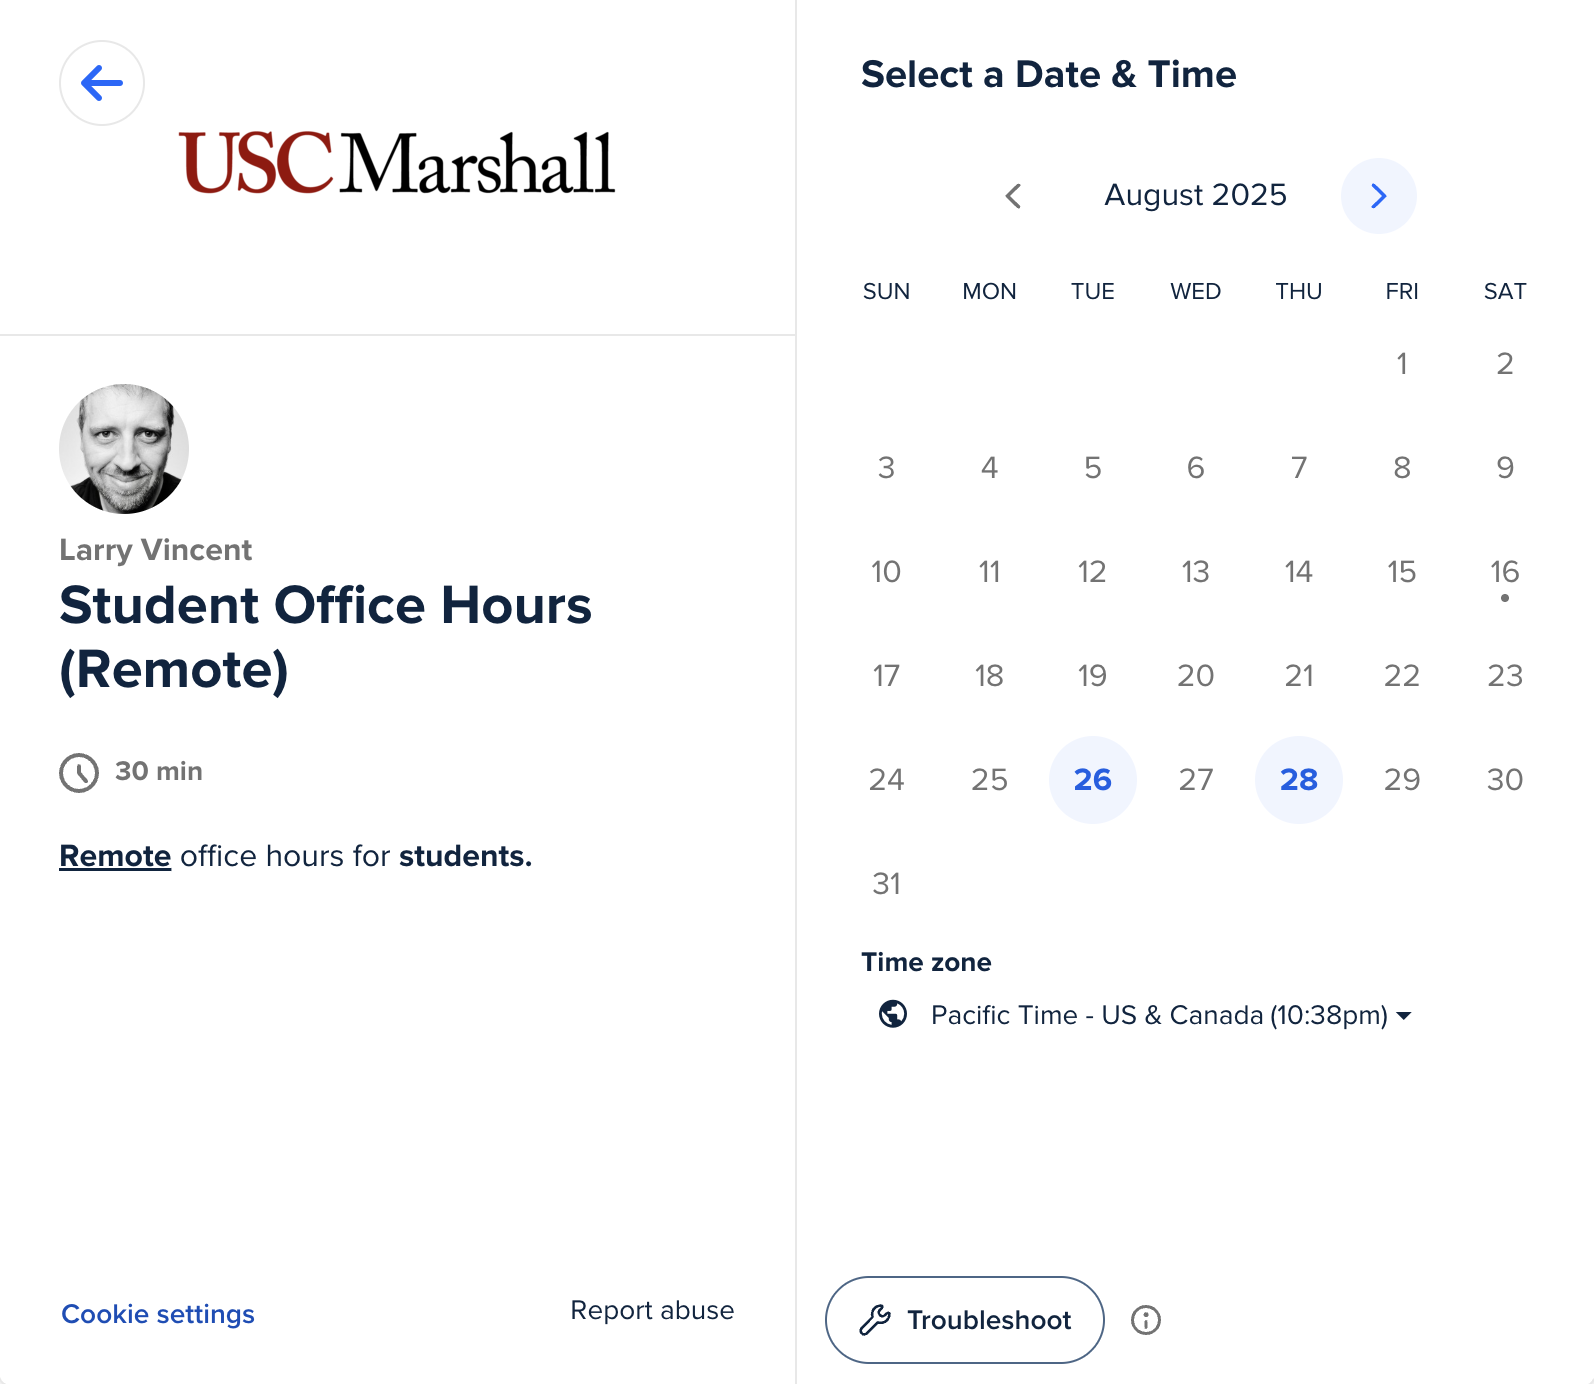
Office hours
- Available by appointment on Calendly (see syllabus for link).
- You can meet with me in groups, if you prefer.
- Not limited to course-related topics :)