Crew’s Cup
Case Discussion
A capstone case on quantitative customer research.
Presented to:
MKT 512
November 13, 2025
MKT 512
November 13, 2025

Theory
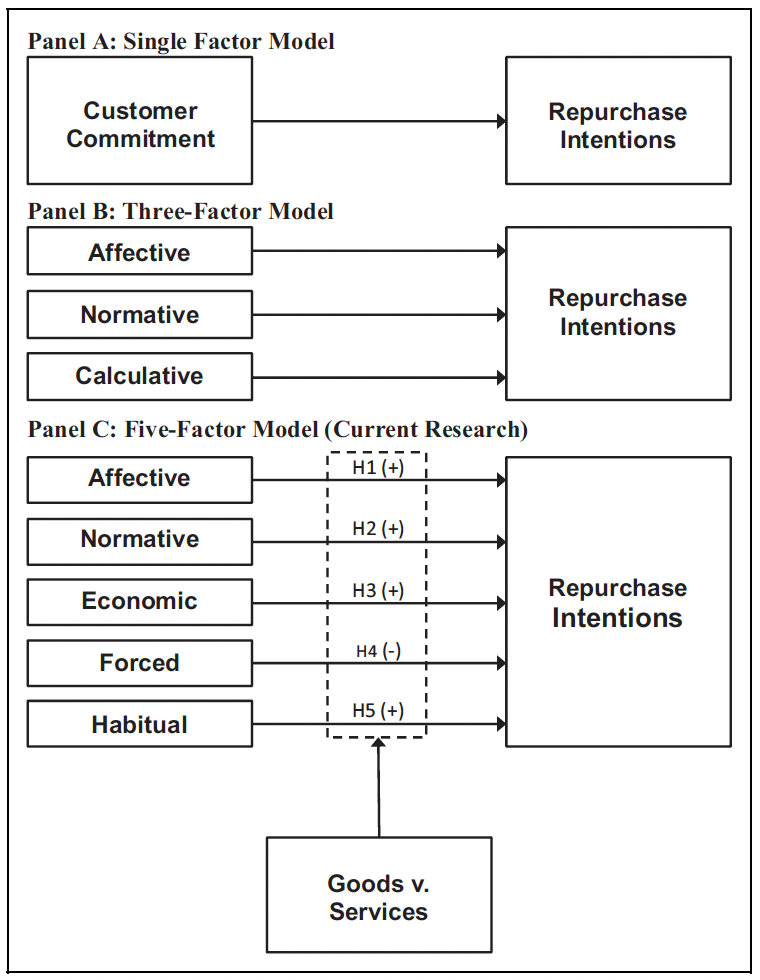
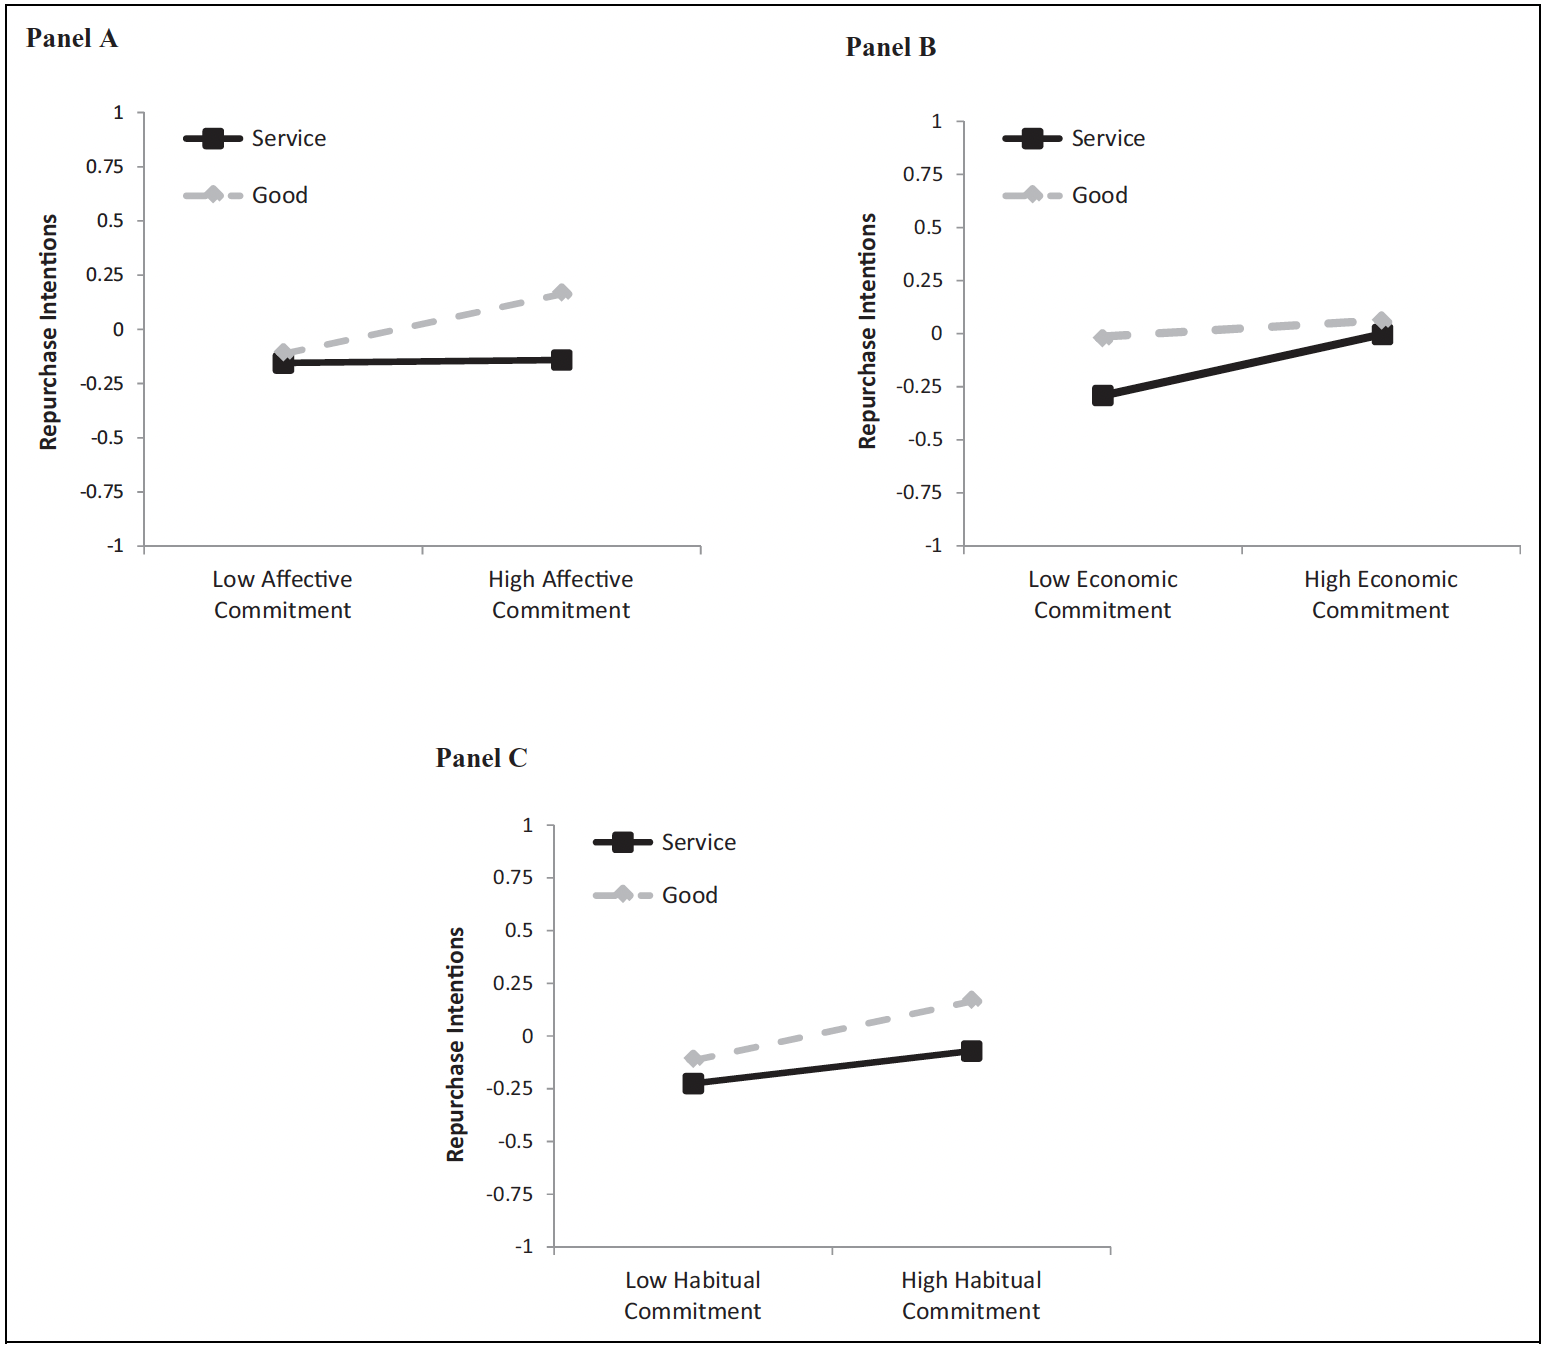
Published Evidence
Factor structure
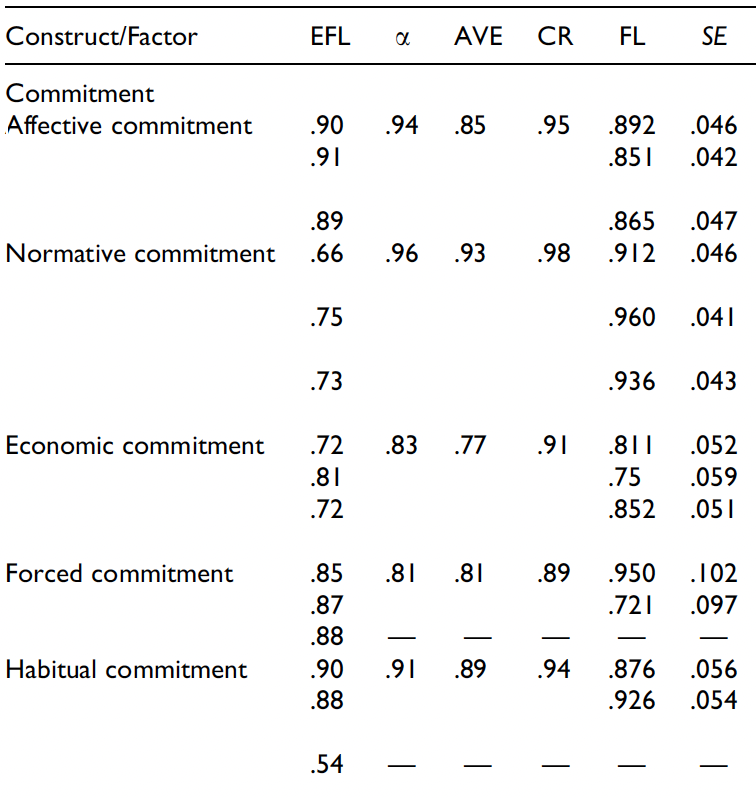
Factor structure
| Exploratory factor analysis | ||||||
| variable | uniqueness | fl1 | fl2 | fl3 | fl4 | fl5 |
|---|---|---|---|---|---|---|
| a1 | 0.161 | −0.048 | 0.056 | 0.913 | −0.023 | −0.001 |
| a2 | 0.263 | 0.297 | −0.147 | 0.786 | 0.091 | 0.033 |
| a3 | 0.318 | −0.119 | 0.090 | 0.812 | 0.023 | 0.008 |
| n1 | 0.218 | −0.097 | 0.876 | 0.061 | −0.016 | −0.016 |
| n2 | 0.154 | −0.122 | 0.908 | 0.057 | −0.040 | −0.044 |
| n3 | 0.109 | −0.054 | 0.938 | −0.090 | −0.011 | 0.024 |
| e1 | 0.101 | 0.839 | −0.178 | 0.165 | 0.370 | 0.005 |
| e2 | 0.086 | 0.847 | −0.118 | 0.197 | 0.377 | −0.037 |
| e3 | 0.065 | 0.854 | −0.194 | 0.191 | 0.364 | −0.005 |
| f1 | 0.080 | 0.894 | −0.125 | 0.041 | 0.005 | 0.323 |
| f2 | 0.085 | 0.901 | −0.082 | 0.007 | −0.025 | 0.310 |
| f3 | 0.085 | 0.870 | −0.136 | 0.151 | −0.059 | 0.335 |
| h1 | 0.064 | 0.940 | −0.005 | −0.149 | −0.076 | −0.158 |
| h2 | 0.042 | 0.948 | −0.025 | −0.115 | −0.099 | −0.191 |
| h3 | 0.074 | 0.941 | −0.027 | −0.115 | −0.048 | −0.158 |
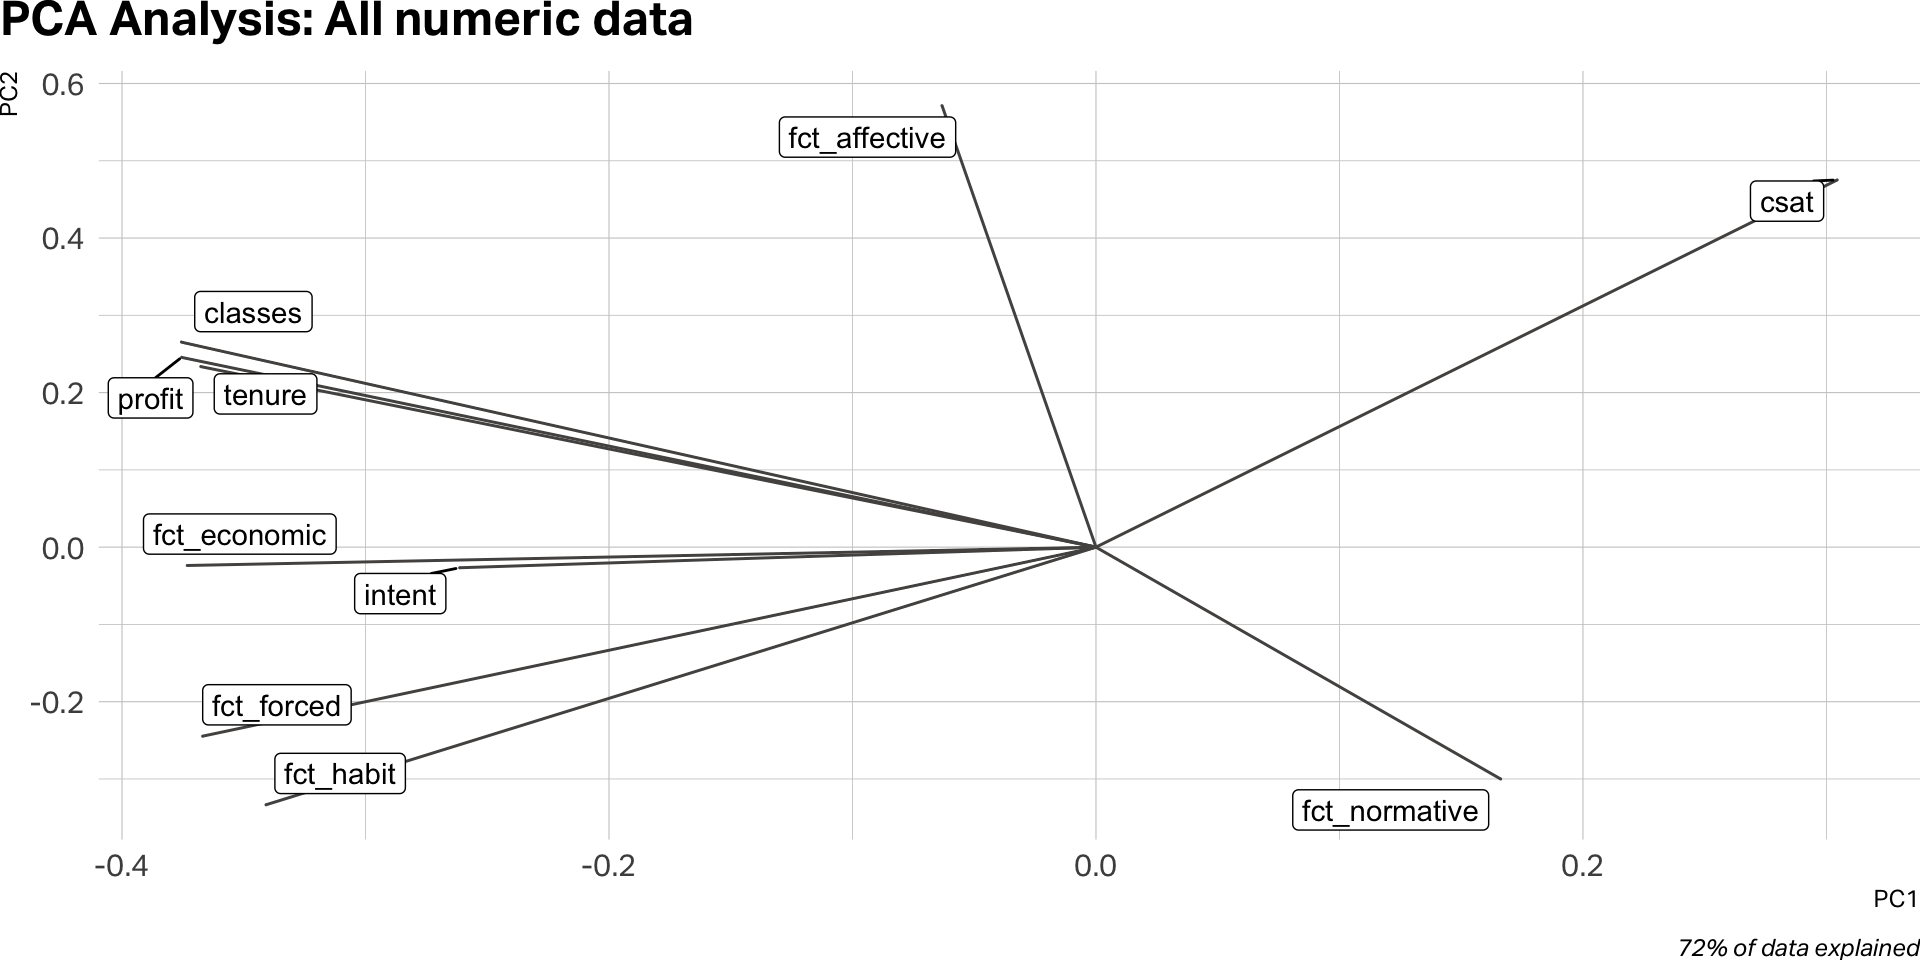
Creating factor variables
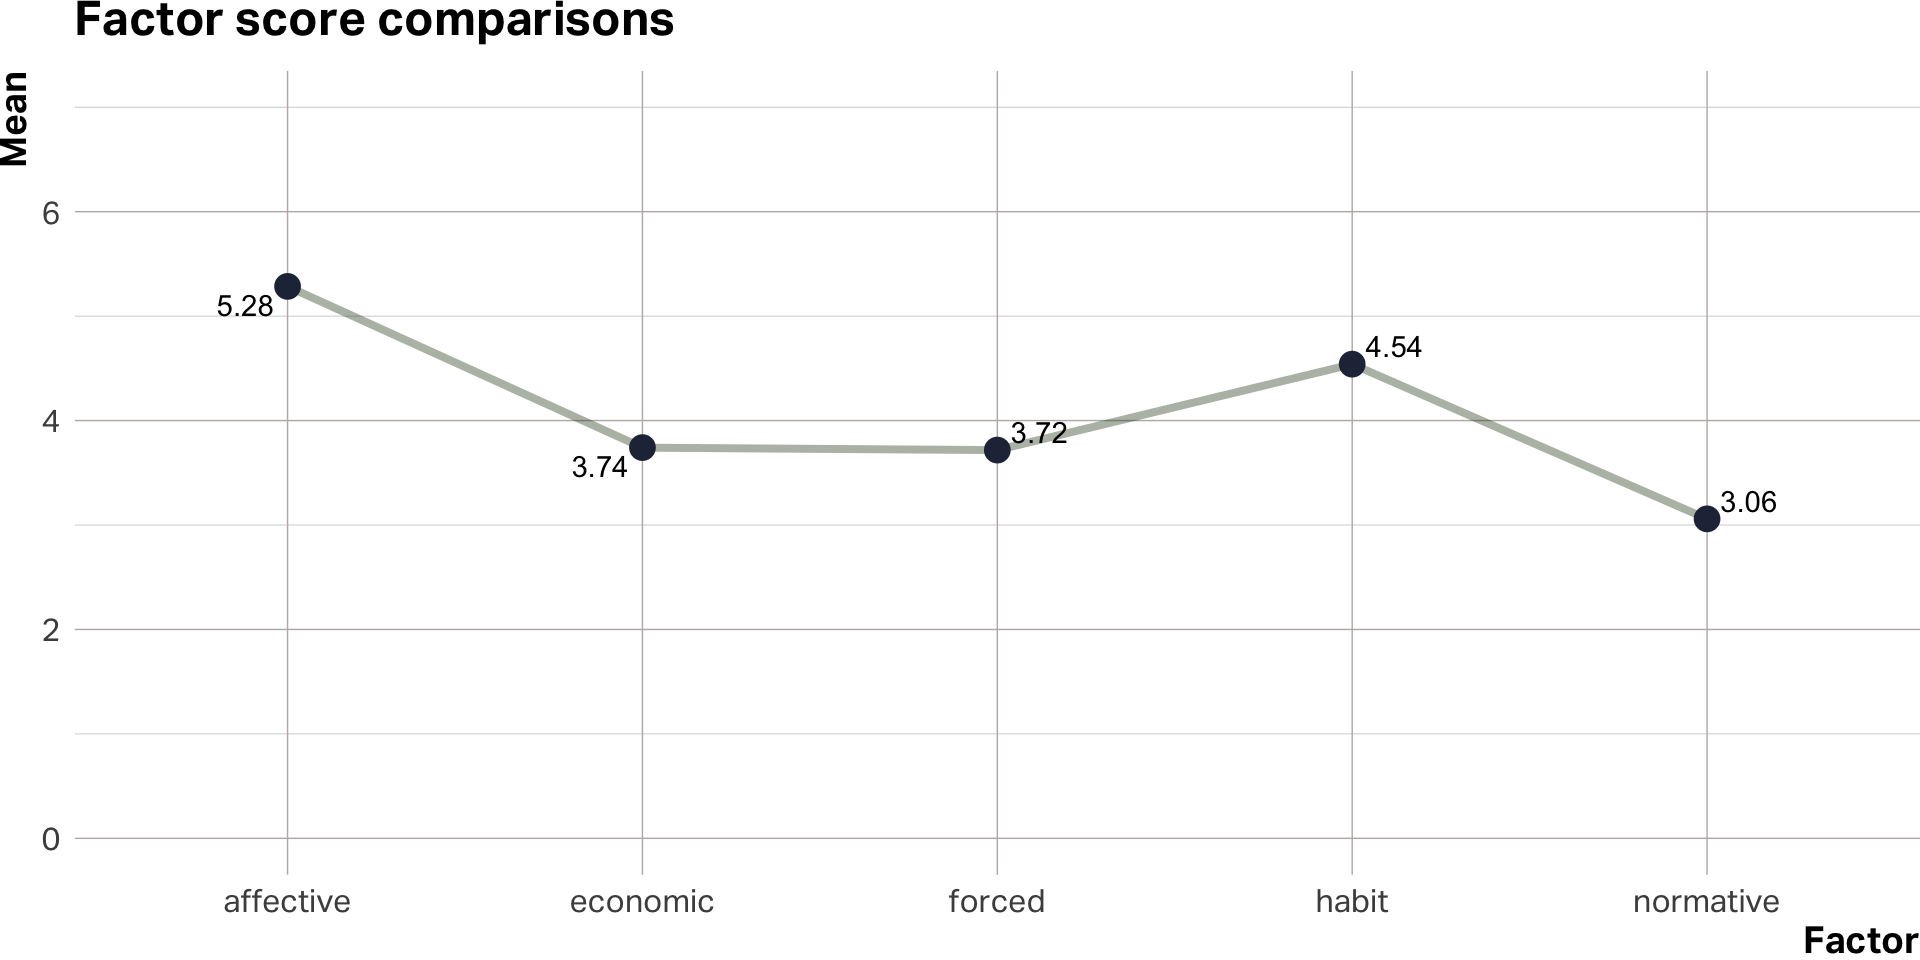
What about committment levels?
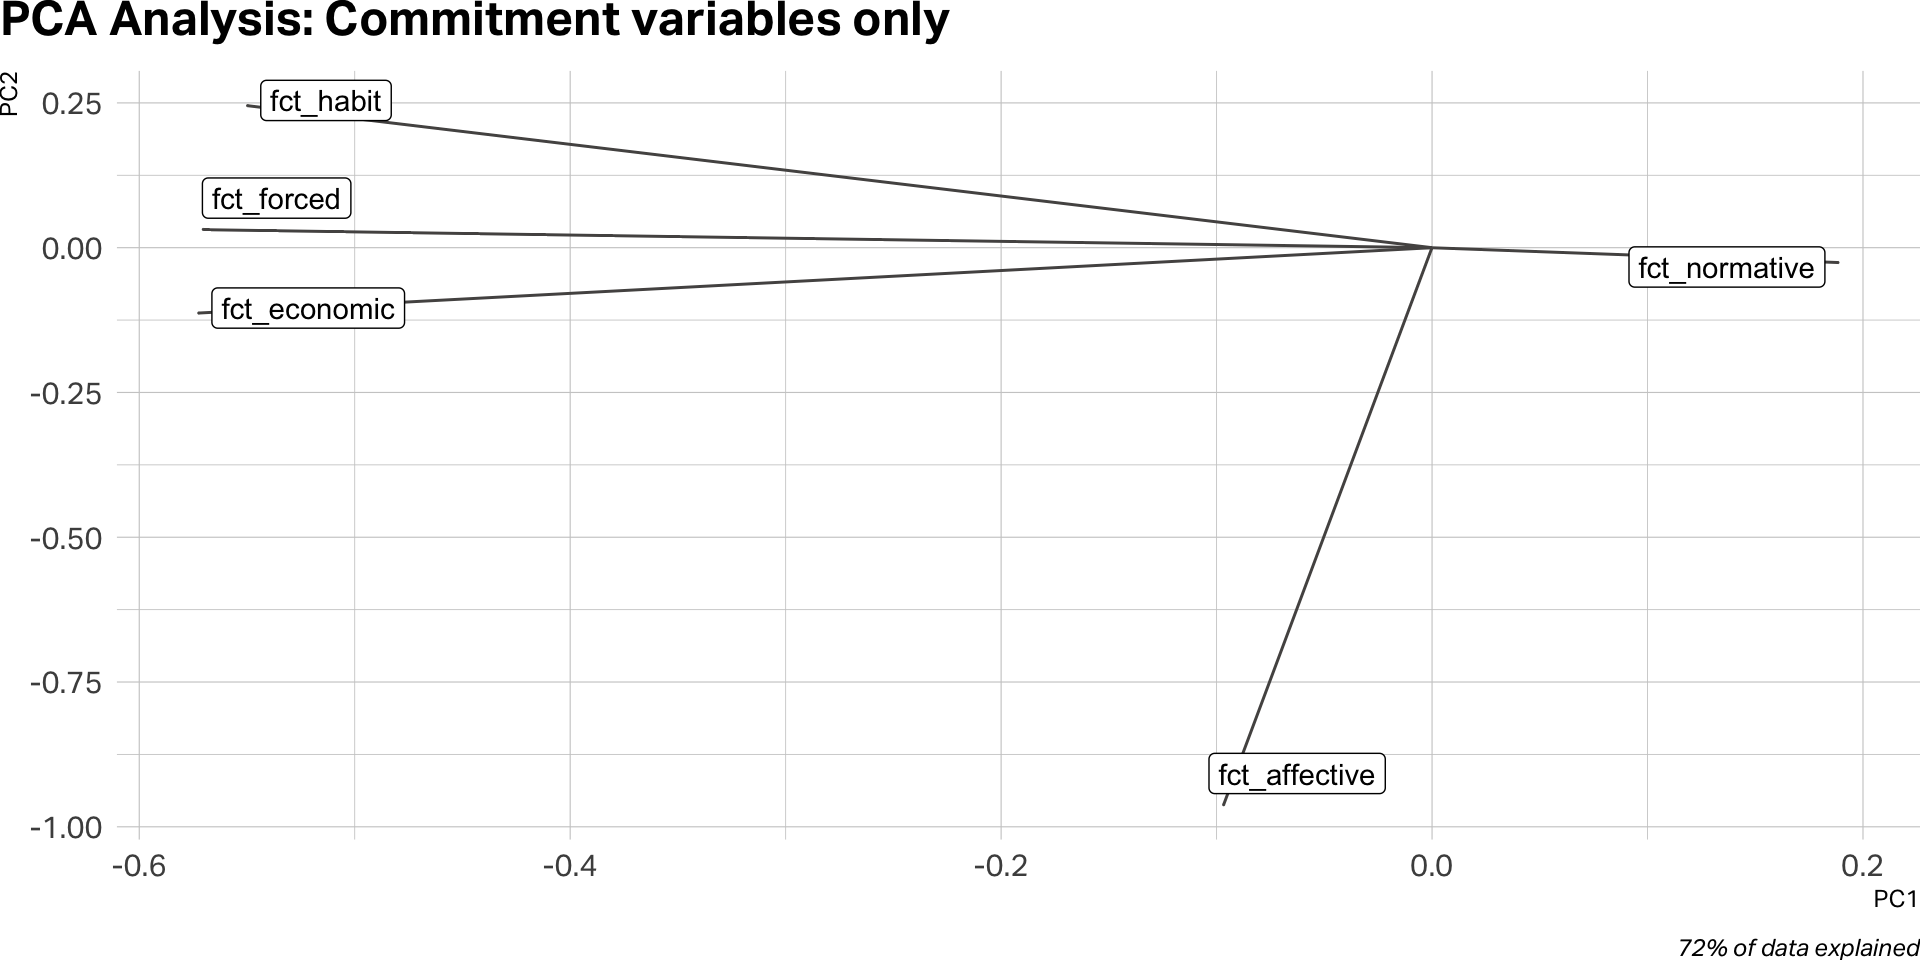
Segmentation
Committment variables only
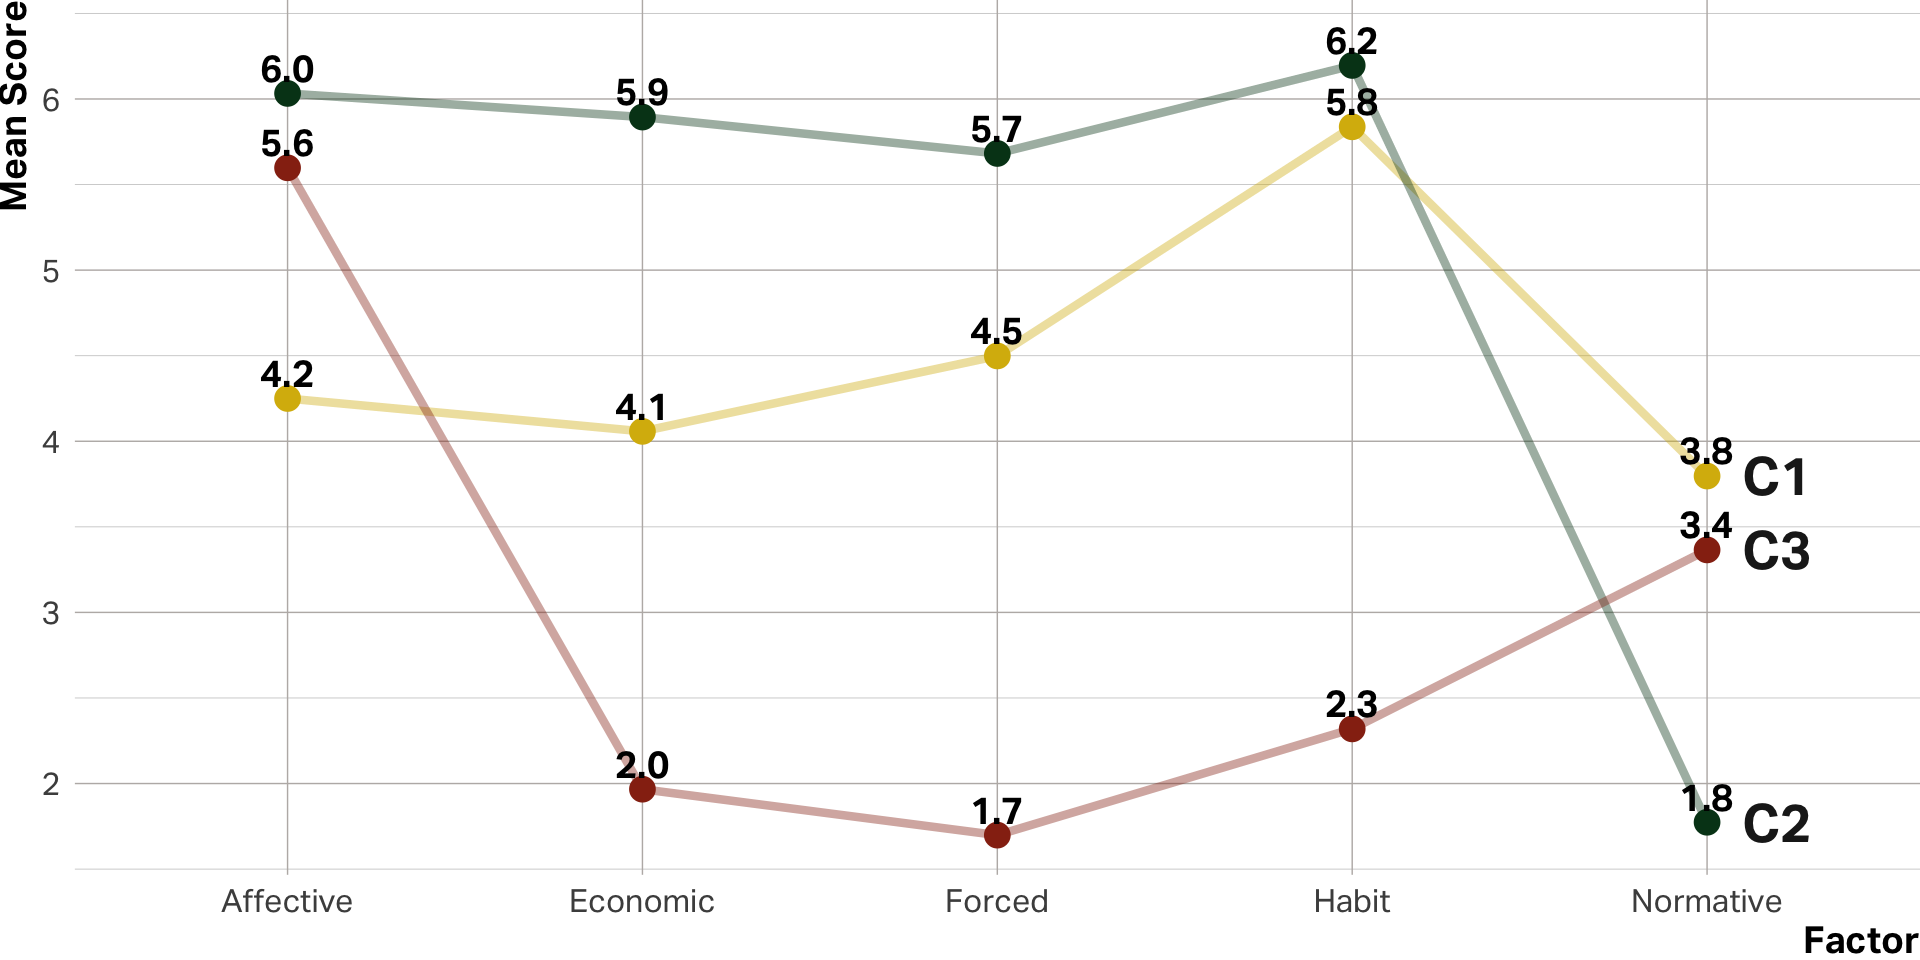
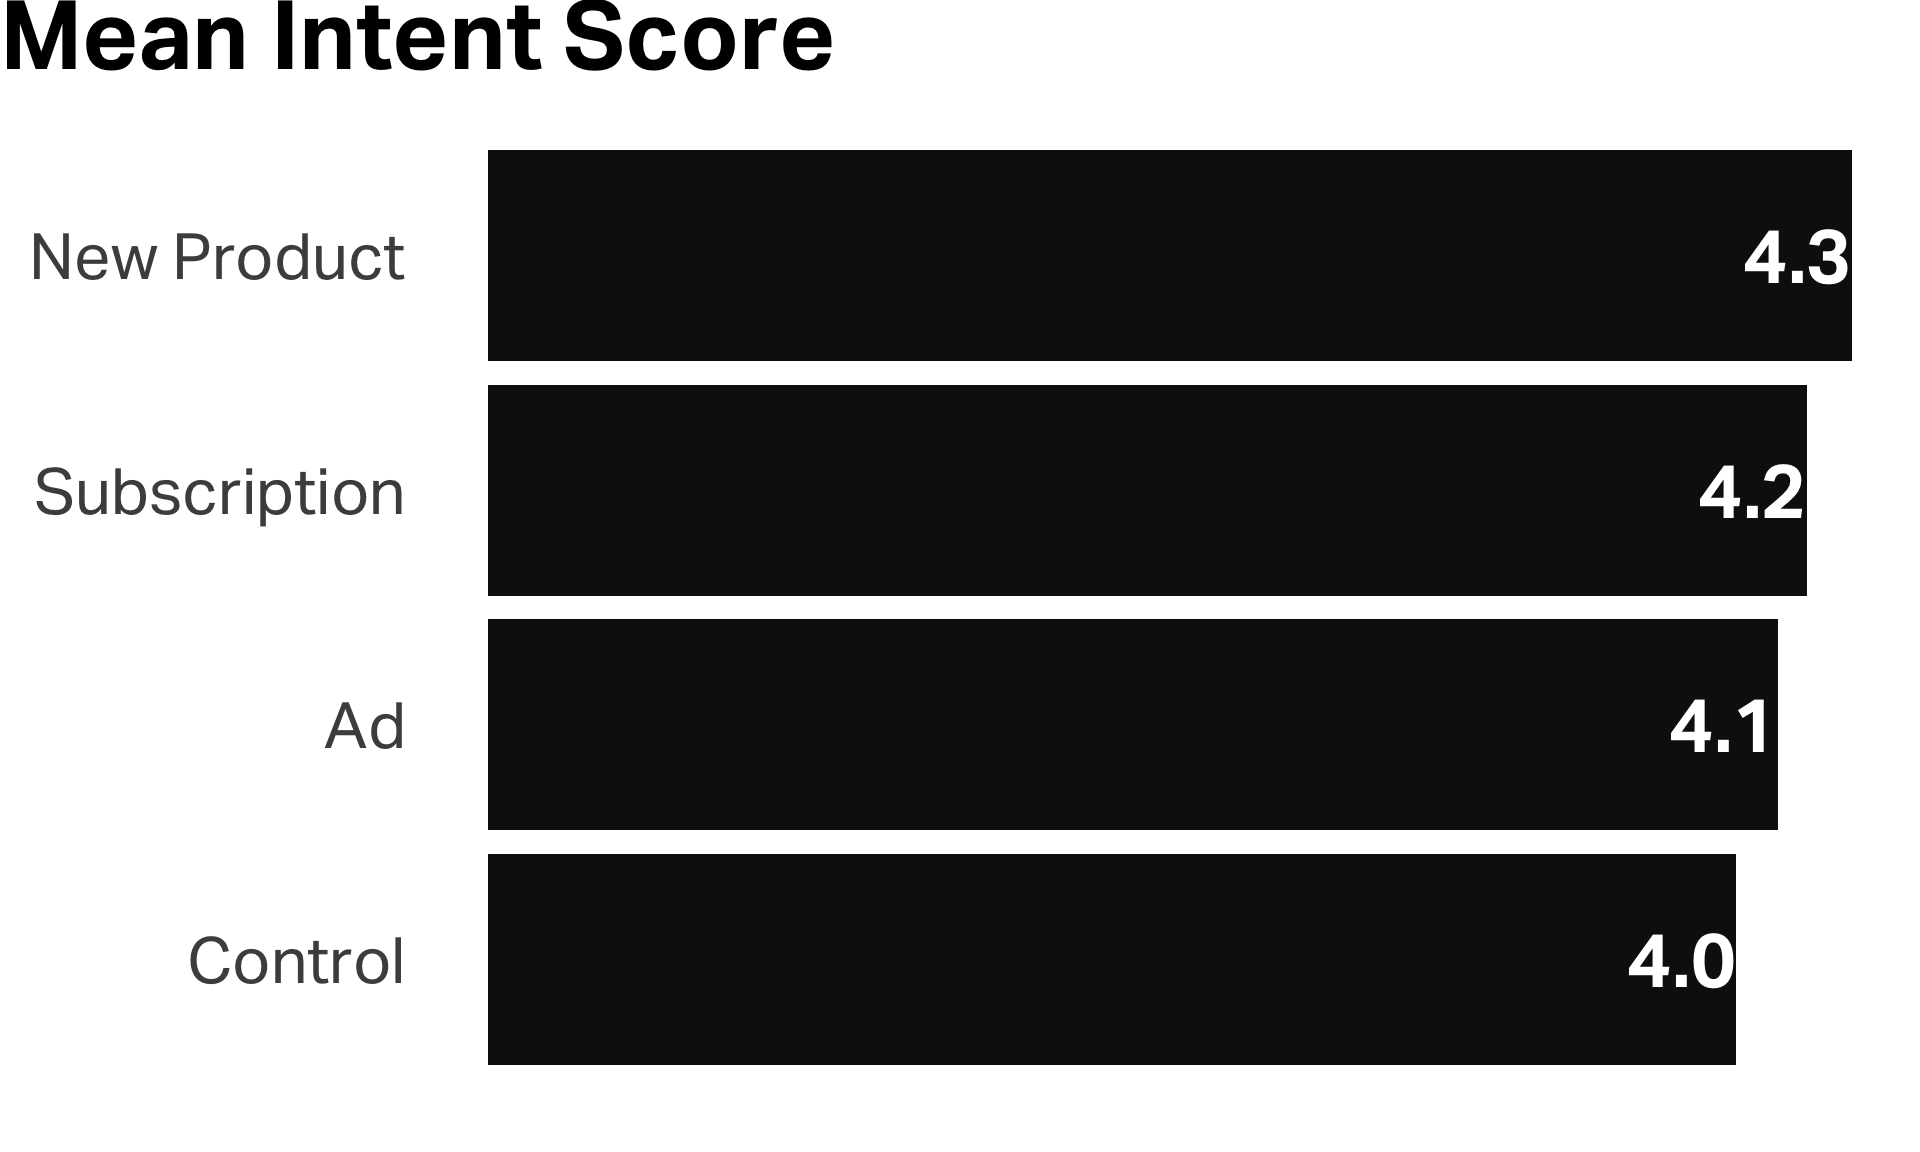
Characteristics by cluster
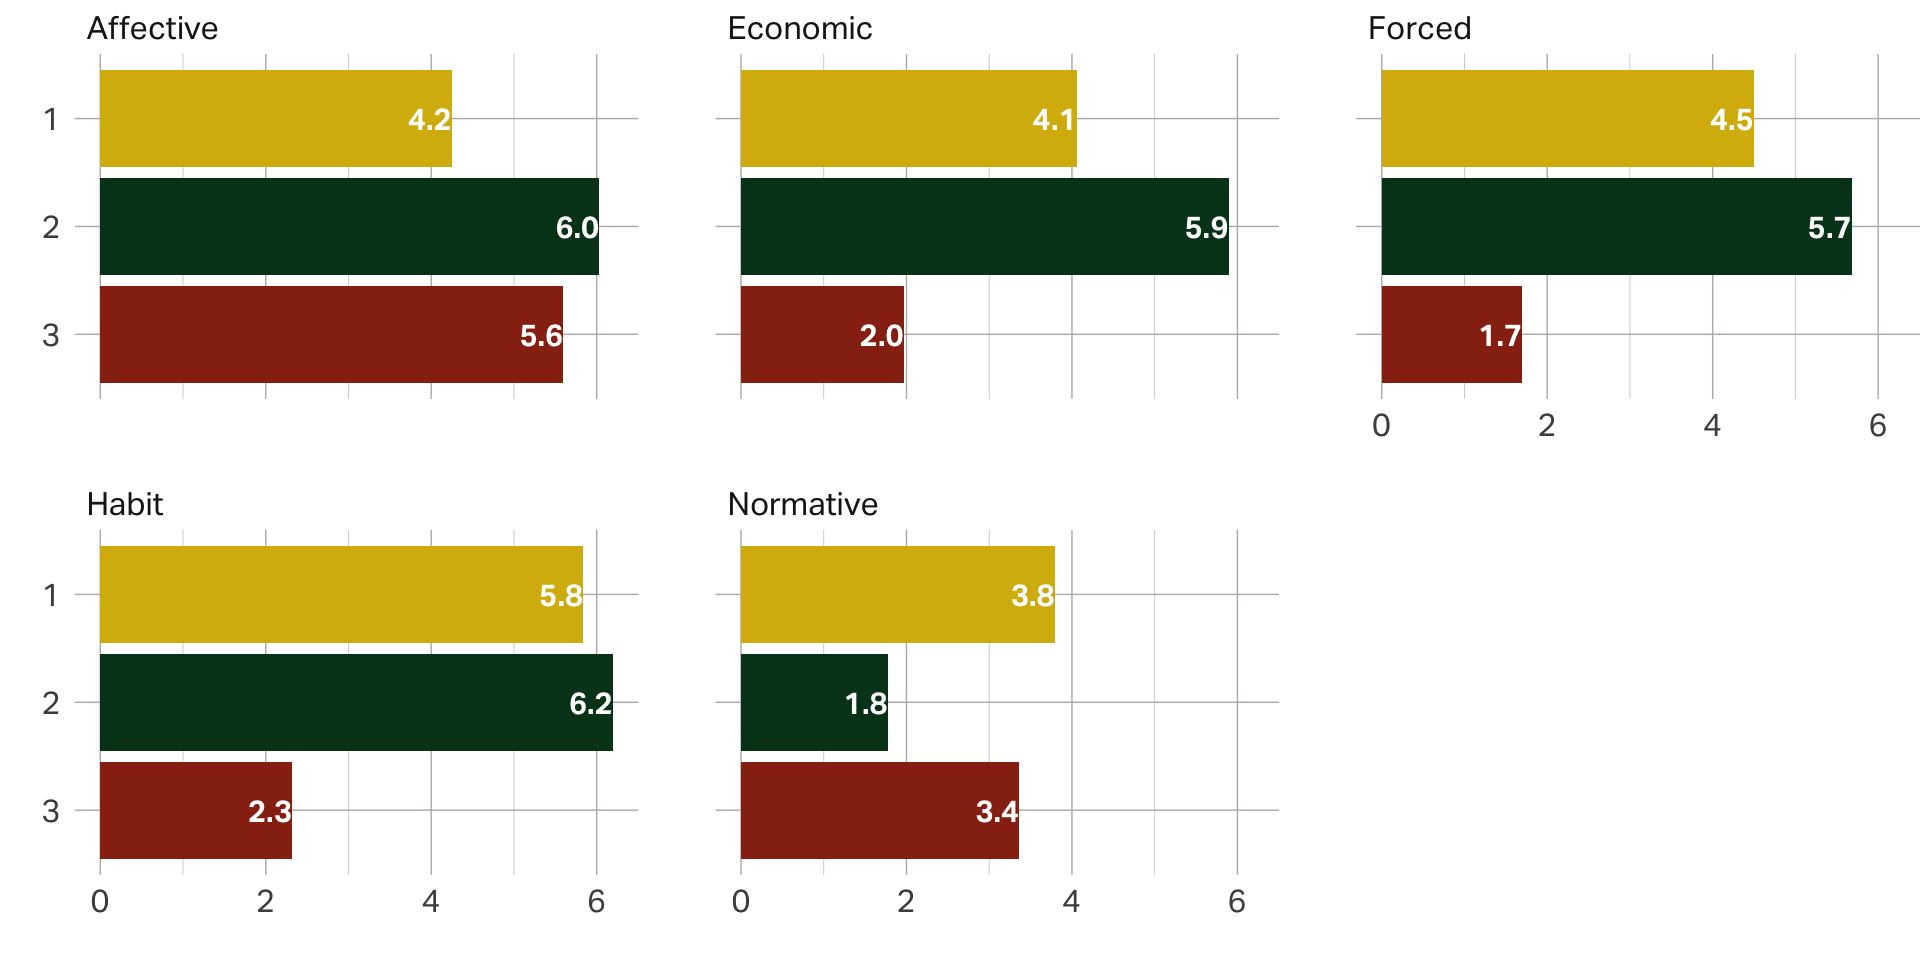
Another view