| Characteristic | Beta1 |
|---|---|
| Natural Growth (Time) | 0.25 (0.06, 0.44)* |
| Field Market Baseline | 0.09 (-0.10, 0.28) |
| Party Market Baseline | 0.43 (0.24, 0.62)*** |
| Field Billboard Effect | 1.0 (0.78, 1.3)*** |
| Party Billboard Effect | 0.35 (0.08, 0.61)* |
| R² | 0.156 |
| Adjusted R² | 0.154 |
| Sigma | 1.18 |
| AIC | 5,700 |
| 1 *p<0.05; **p<0.01; ***p<0.001 | |
| Abbreviation: CI = Confidence Interval | |
Experimental Design
Overview
Designing research that is representative of business decisions and customer behavior.
Presented by:
Larry Vincent,
Professor of the Practice, Marketing
Larry Vincent,
Professor of the Practice, Marketing
Presented to:
MKT 512
October 14, 2025
MKT 512
October 14, 2025

Design


| Factor | Levels | Description |
|---|---|---|
| Billboard Condition (Between-subjects) |
Field Party Control |
10 markets assigned to Field billboard 10 markets assigned to Party billboard 10 markets assigned to no billboard |
| Time Period (Between-subjects) |
Pre Post |
30 days before billboard deployment 30 days after billboard deployment |
Results

Results
Analog Autumn
Denimous’ creative agency noticed a retro trend growing on the east coast that glorifies the early 90s. The trend pairs well with the fall collection of denim, which has bigger waistlines, baggier fits, and soft, bleached and distressed denim.
- Gen Z is driving 90s nostalgia–340% increase in “90s fashion” mentions on TikTok/Instagram among 18-25 year-olds over past 18 months
- Dual audience opportunity–Primary target is trend-forward Gen Z; secondary target is Millennials (35-45) with higher discretionary income who actually lived through the era
- Product alignment–Relaxed-fit styles matching 90s silhouettes show 2.3x higher repeat purchase rates than contemporary fits
- Agency hypothesis–Nostalgia-inspired creative and activation experiences will resonate with Gen Z (aspirational/cool) while triggering authentic memories in Millennials, potentially re-engaging lapsed customers
- Research objective–Management worries that nostalgia is a “third rail” that could link the brand as “old” and “outdated.” They want to test whether nostalgia priming increases or decreases purchase intent and willingness to pay, particularly among GenZ
Experimental Design: Nostalgia Priming for Denimous “Analog Autumn” Campaign
| Factor | Levels | Description |
|---|---|---|
| Age Group (Between-subjects) | Gen Z (18-27) Millennials (35-45) | 200 participants aged 18-27 200 participants aged 35-45 |
| Priming Condition (Between-subjects) | Nostalgia (1990s scene) | Read nostalgic prompt about 1990s evening (Friends, Britney, corded phone) |
| Control (contemporary scene) | Read neutral prompt about current evening routine |
Experimental Layout (2×2 Factorial Design)
| Nostalgia Prime | Control Prime | |
|---|---|---|
| Gen Z (18-27) | n = 100 Read 1990s nostalgic scene → Evaluate Denimous brand | n = 100 Read contemporary scene → Evaluate Denimous brand |
| Millennials (35-45) | n = 100 Read 1990s nostalgic scene → Evaluate Denimous brand | n = 100 Read contemporary scene → Evaluate Denimous brand |
Sample Size & Measurement
| Element | Details |
|---|---|
| Total participants | 400 |
| Participants per cell | 100 (in each of 4 conditions) |
| Design type | 2×2 Between-subjects factorial |
| Primary DV | Brand engagement intentions (1-7 Likert scale) |
| Secondary DVs | Purchase intent (1-7) Willingness to pay ($) Brand perceptions (authentic, outdated, modern) |
| Manipulation check | “To what extent did you feel nostalgic?” (1-7) |
Hypotheses
H1 (Main Effect): Nostalgia priming will increase brand engagement intentions compared to control
H2 (Interaction): The nostalgia effect will be moderated by age group, with Gen Z showing stronger positive effects than Millennials
H3 (Brand Perception): Gen Z will rate the nostalgic brand as less outdated (retro = trendy), while Millennials may rate it as more outdated
Stimulus
Treatment
Imagine a weeknight evening in the mid-1990s. You’ve just finished watching your favorite TV show–maybe Friends, or Seinfeld, or Beverly Hills 90210. A song comes on–perhaps Britney Spears, the Backstreet Boys, or TLC. You’re wearing your most comfortable clothes, relaxing at home. You might be talking on a corded phone with the extra-long cord, or flipping through a magazine. Take a moment to picture this scene vividly in your mind. What else do you remember about evenings like this in the 1990s? Please write 2-3 sentences describing what comes to mind.
Control
Imagine a typical weeknight evening today. You’ve just finished watching a show on your streaming service. You’re listening to music or a podcast. You’re wearing your most comfortable clothes, relaxing at home. You might be scrolling through your phone or browsing online. Take a moment to picture this scene vividly in your mind. What else characterizes your typical evening routine? Please write 2-3 sentences describing what comes to mind.
Results

Results
| Characteristic |
Nostalgia
|
w/Age
|
w/Interaction
|
|---|---|---|---|
| Beta1 | Beta1 | Beta1 | |
| nostalgia | 0.85 (0.66, 1.0)*** | 0.85 (0.68, 1.0)*** | 1.4 (1.1, 1.6)*** |
| millennial | -0.69 (-0.86, -0.52)*** | -0.18 (-0.40, 0.05) | |
| nostalgia * millennial | -1.0 (-1.4, -0.71)*** | ||
| R² | 0.172 | 0.287 | 0.351 |
| Adjusted R² | 0.170 | 0.283 | 0.346 |
| Sigma | 0.929 | 0.863 | 0.824 |
| AIC | 1,080 | 1,022 | 987 |
| 1 *p<0.05; **p<0.01; ***p<0.001 | |||
| Abbreviation: CI = Confidence Interval | |||
Artea
Background
- Online retailer of casual apparel
- Recent data suggests 87% of site visitors do not complete a transaction
- CEO wishes to conduct experiment to see if a coupon increases conversion
- 5,000 customers who purchased in last two months were selected; half received a coupon for 20% off next purchase
- The other half did not receive a coupon but their behavior was tracked
Artea
| variable | Median | Mean | SD | Min | Max |
|---|---|---|---|---|---|
| id | 8,500 | 8,500.50 | 1,443.52 | 6,001.00 | 11,000.00 |
| trans_after | 0 | 0.14 | 0.42 | 0.00 | 5.00 |
| revenue_after | 0 | 7.66 | 23.63 | 0.00 | 247.96 |
| test_coupon | 1 | 0.50 | 0.50 | 0.00 | 1.00 |
| channel_acq | 2 | 2.07 | 1.05 | 1.00 | 5.00 |
| num_past_purch | 1 | 2.06 | 2.56 | 0.00 | 22.00 |
| spent_last_purchase | 57 | 57.42 | 55.47 | 0.00 | 361.96 |
| weeks_since_visit | 3 | 3.22 | 2.26 | 0.00 | 7.00 |
| browsing_minutes | 14 | 13.69 | 6.96 | 1.00 | 37.00 |
| shopping_cart | 0 | 0.29 | 0.46 | 0.00 | 1.00 |
Data Structure

Initial regression
| Characteristic |
Transactions
|
Revenue
|
||||
|---|---|---|---|---|---|---|
| Beta | 95% CI | p-value | Beta | 95% CI | p-value | |
| Coupon | 0.03 | 0.00, 0.05 | 0.027 | -0.24 | -1.6, 1.1 | 0.7 |
| Abbreviation: CI = Confidence Interval | ||||||
Effect of Coupon

Randomization Check
| Characteristic | Beta1 |
|---|---|
| channel_acq | |
| — | |
| 0.02 (-0.02, 0.06) | |
| 0.00 (-0.03, 0.03) | |
| Referral | 0.03 (-0.04, 0.10) |
| Other | 0.01 (-0.09, 0.10) |
| num_past_purch | 0.00 (0.00, 0.01) |
| spent_last_purchase | 0.00 (0.00, 0.00) |
| weeks_since_visit | 0.00 (0.00, 0.01) |
| browsing_minutes | 0.00 (0.00, 0.00) |
| shopping_cart | -0.02 (-0.05, 0.01) |
| R² | 0.001 |
| Adjusted R² | -0.001 |
| Sigma | 0.500 |
| AIC | 7,274 |
| 1 *p<0.05; **p<0.01; ***p<0.001 | |
| Abbreviation: CI = Confidence Interval | |
Transaction Drivers
| Characteristic |
Initial
|
Loaded
|
||
|---|---|---|---|---|
| Beta | 95% CI | p-value | Beta1 | |
| Coupon | 0.03 | 0.00, 0.05 | 0.027 | 0.03 (0.00, 0.05)* |
| channel_acq | ||||
| — | ||||
| 0.11 (0.08, 0.14)*** | ||||
| 0.11 (0.08, 0.13)*** | ||||
| Referral | 0.13 (0.08, 0.18)*** | |||
| Other | 0.16 (0.09, 0.23)*** | |||
| num_past_purch | 0.06 (0.05, 0.06)*** | |||
| spent_last_purchase | 0.00 (0.00, 0.00)*** | |||
| weeks_since_visit | -0.02 (-0.03, -0.02)*** | |||
| browsing_minutes | 0.00 (0.00, 0.00)*** | |||
| shopping_cart | 0.17 (0.15, 0.20)*** | |||
| R² | 0.177 | |||
| Adjusted R² | 0.176 | |||
| Sigma | 0.381 | |||
| AIC | 4,548 | |||
| 1 *p<0.05; **p<0.01; ***p<0.001 | ||||
| Abbreviation: CI = Confidence Interval | ||||
Revenue Drivers
| Characteristic |
Initial
|
Loaded
|
||
|---|---|---|---|---|
| Beta | 95% CI | p-value | Beta1 | |
| Coupon | -0.24 | -1.6, 1.1 | 0.7 | -0.28 (-1.5, 0.91) |
| channel_acq | ||||
| — | ||||
| 6.0 (4.4, 7.6)*** | ||||
| 6.0 (4.5, 7.4)*** | ||||
| Referral | 6.7 (3.8, 9.6)*** | |||
| Other | 8.7 (4.7, 13)*** | |||
| num_past_purch | 3.2 (2.9, 3.4)*** | |||
| spent_last_purchase | -0.01 (-0.03, 0.00)* | |||
| weeks_since_visit | -1.1 (-1.4, -0.85)*** | |||
| browsing_minutes | 0.16 (0.07, 0.25)*** | |||
| shopping_cart | 9.3 (8.0, 11)*** | |||
| R² | 0.171 | |||
| Adjusted R² | 0.170 | |||
| Sigma | 21.5 | |||
| AIC | 44,898 | |||
| 1 *p<0.05; **p<0.01; ***p<0.001 | ||||
| Abbreviation: CI = Confidence Interval | ||||
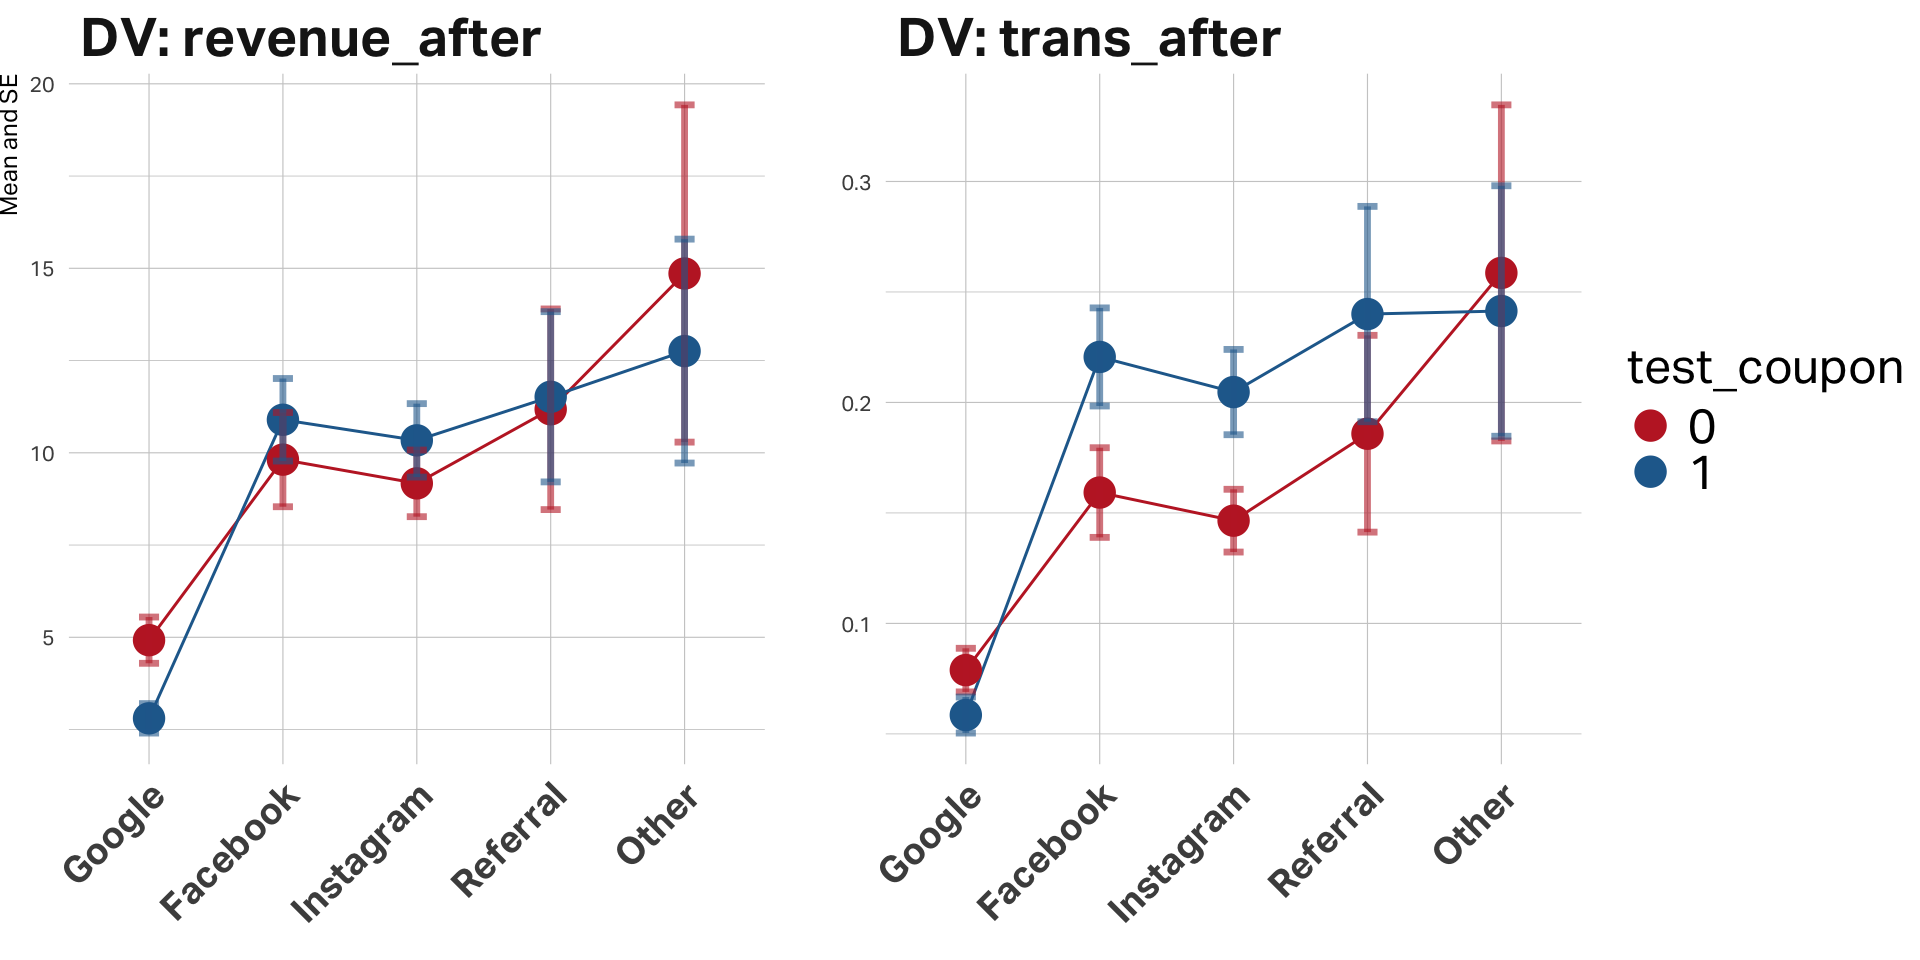
Which channel is best?
Channel proportions

Acquisition effects
Acquisition effects on transactions
| Characteristic |
Initial
|
Channels
|
|---|---|---|
| Beta1 | Beta1 | |
| Coupon | 0.03 (0.00, 0.05)* | 0.02 (0.00, 0.05)* |
| channel_acq | ||
| — | ||
| 0.12 (0.09, 0.15)*** | ||
| 0.11 (0.08, 0.13)*** | ||
| Referral | 0.14 (0.09, 0.20)*** | |
| Other | 0.18 (0.10, 0.26)*** | |
| R² | 0.001 | 0.021 |
| Adjusted R² | 0.001 | 0.020 |
| Sigma | 0.419 | 0.415 |
| AIC | 5,502 | 5,409 |
| 1 p<0.05; p<0.01; p<0.001 | ||
| Abbreviation: CI = Confidence Interval | ||
Channel/TX interactions
| Characteristic |
Initial
|
Channels
|
|---|---|---|
| Beta1 | Beta1 | |
| Coupon | -0.02 (-0.06, 0.02) | -0.01 (-0.04, 0.02) |
| channel_acq | ||
| — | — | |
| 0.08 (0.04, 0.12)*** | 0.09 (0.05, 0.13)*** | |
| 0.07 (0.03, 0.11)*** | 0.07 (0.04, 0.11)*** | |
| Referral | 0.11 (0.03, 0.19)** | 0.09 (0.02, 0.17)* |
| Other | 0.18 (0.07, 0.29)** | 0.16 (0.06, 0.26)** |
| Coupon * channel_acq | ||
| Coupon * Facebook | 0.08 (0.02, 0.14)** | 0.05 (0.00, 0.11) |
| Coupon * Instagram | 0.08 (0.02, 0.13)** | 0.07 (0.02, 0.12)** |
| Coupon * Referral | 0.07 (-0.04, 0.19) | 0.07 (-0.03, 0.17) |
| Coupon * Other | 0.00 (-0.15, 0.16) | -0.01 (-0.15, 0.13) |
| num_past_purch | 0.06 (0.05, 0.06)*** | |
| spent_last_purchase | 0.00 (0.00, 0.00)*** | |
| weeks_since_visit | -0.02 (-0.03, -0.02)*** | |
| browsing_minutes | 0.00 (0.00, 0.00)*** | |
| shopping_cart | 0.17 (0.15, 0.20)*** | |
| R² | 0.023 | 0.179 |
| Adjusted R² | 0.021 | 0.177 |
| Sigma | 0.415 | 0.381 |
| AIC | 5,406 | 4,547 |
| 1 *p<0.05; **p<0.01; ***p<0.001 | ||
| Abbreviation: CI = Confidence Interval | ||
Channel/Rev interactions
| Characteristic |
Initial
|
Channels
|
|---|---|---|
| Beta1 | Beta1 | |
| Coupon | -2.1 (-4.2, -0.08)* | -1.6 (-3.5, 0.25) |
| channel_acq | ||
| — | — | |
| 4.9 (2.4, 7.4)*** | 5.3 (3.0, 7.6)*** | |
| 4.2 (2.1, 6.4)*** | 4.5 (2.5, 6.5)*** | |
| Referral | 6.3 (1.7, 11)** | 5.5 (1.3, 9.7)* |
| Other | 9.9 (3.7, 16)** | 9.0 (3.3, 15)** |
| Coupon * channel_acq | ||
| Coupon * Facebook | 3.2 (-0.28, 6.7) | 1.5 (-1.7, 4.7) |
| Coupon * Instagram | 3.3 (0.19, 6.4)* | 3.0 (0.11, 5.8)* |
| Coupon * Referral | 2.5 (-3.8, 8.8) | 2.3 (-3.5, 8.1) |
| Coupon * Other | 0.02 (-8.7, 8.8) | -0.67 (-8.7, 7.4) |
| num_past_purch | 3.2 (2.9, 3.4)*** | |
| spent_last_purchase | -0.01 (-0.03, 0.00)* | |
| weeks_since_visit | -1.1 (-1.4, -0.85)*** | |
| browsing_minutes | 0.16 (0.07, 0.25)*** | |
| shopping_cart | 9.3 (8.0, 11)*** | |
| R² | 0.020 | 0.172 |
| Adjusted R² | 0.018 | 0.170 |
| Sigma | 23.4 | 21.5 |
| AIC | 45,736 | 44,901 |
| 1 *p<0.05; **p<0.01; ***p<0.001 | ||
| Abbreviation: CI = Confidence Interval | ||
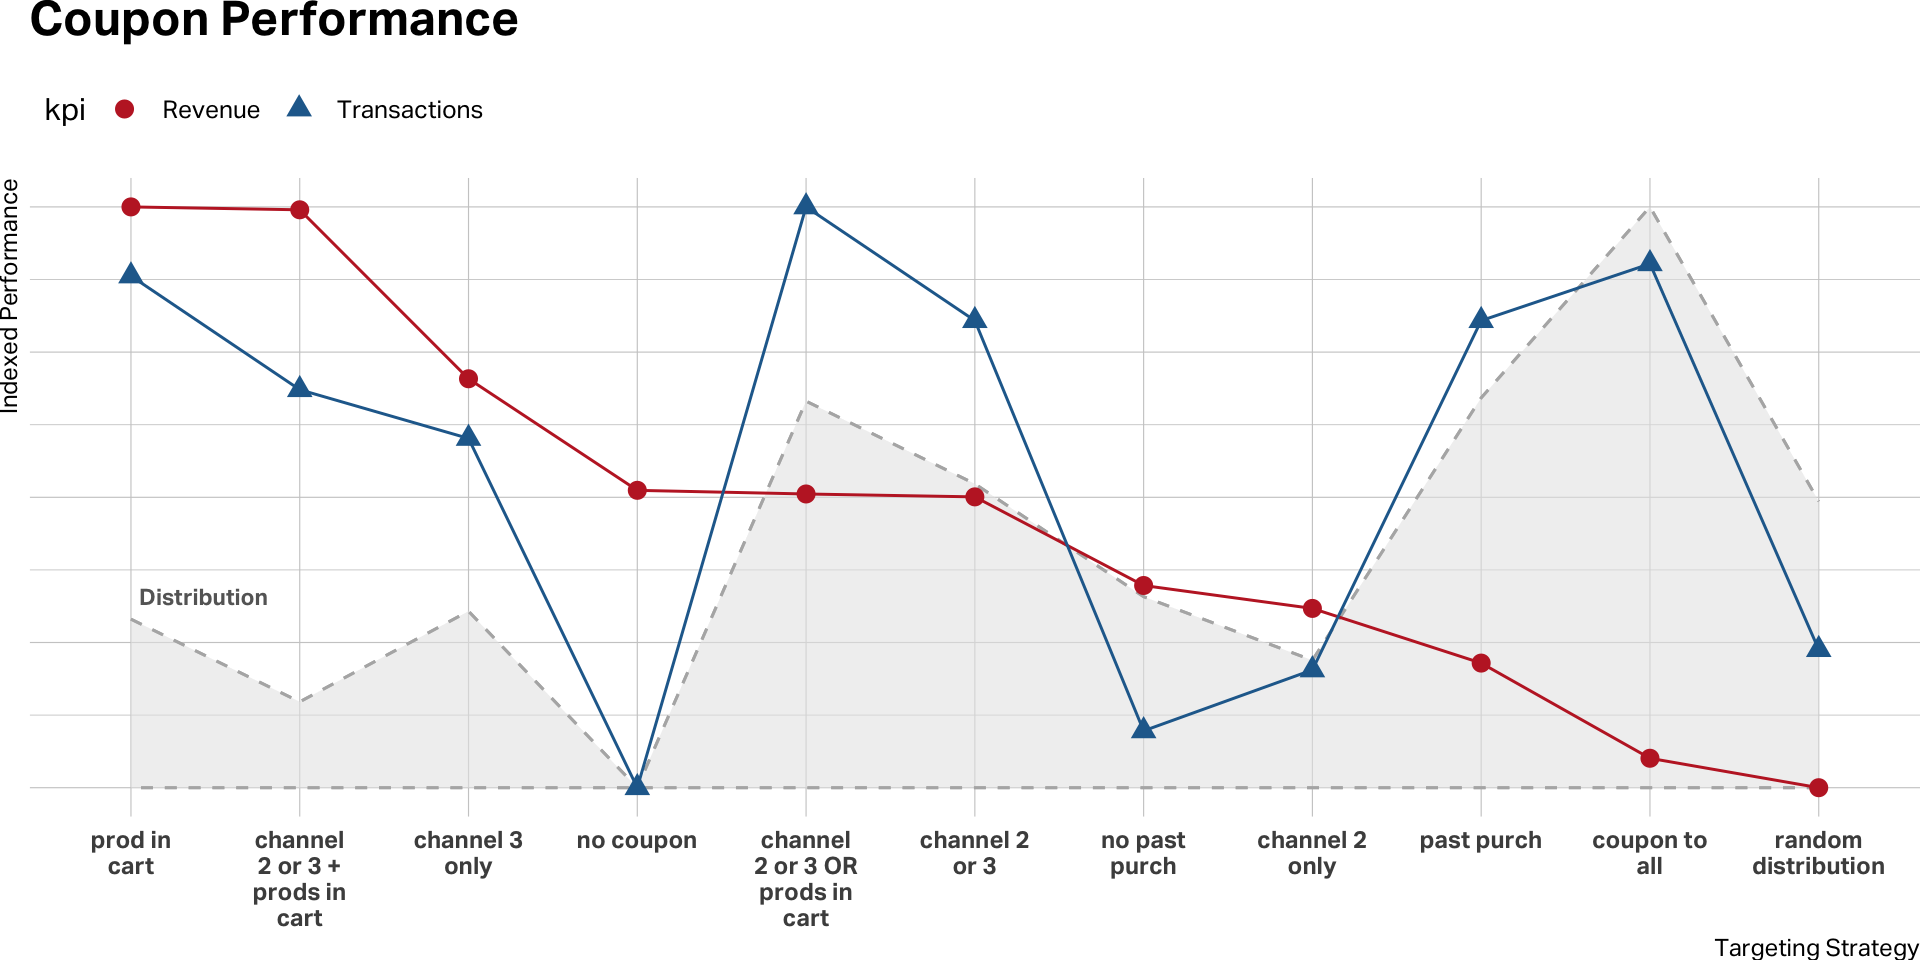
Targeting
Review
What does the demographic data reveal?
Sample demographics

Women
People of Color
Women of Color
White Men
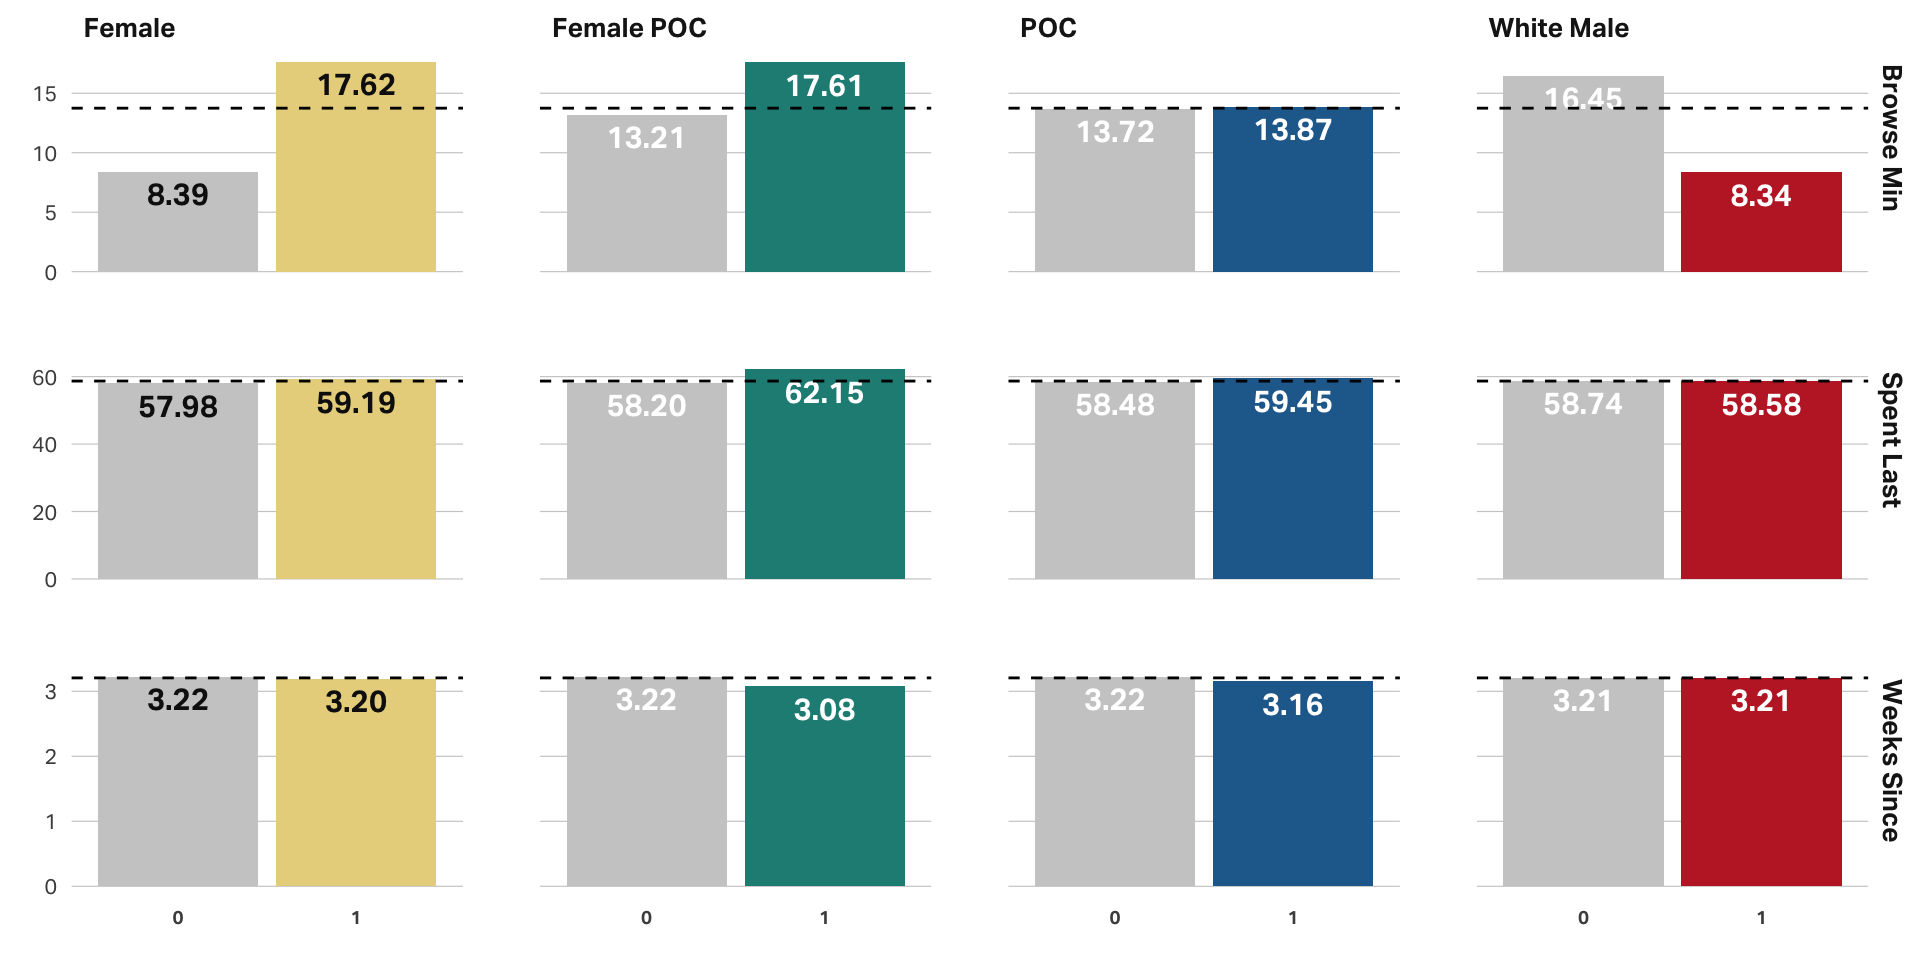
Other purchase drivers by demo
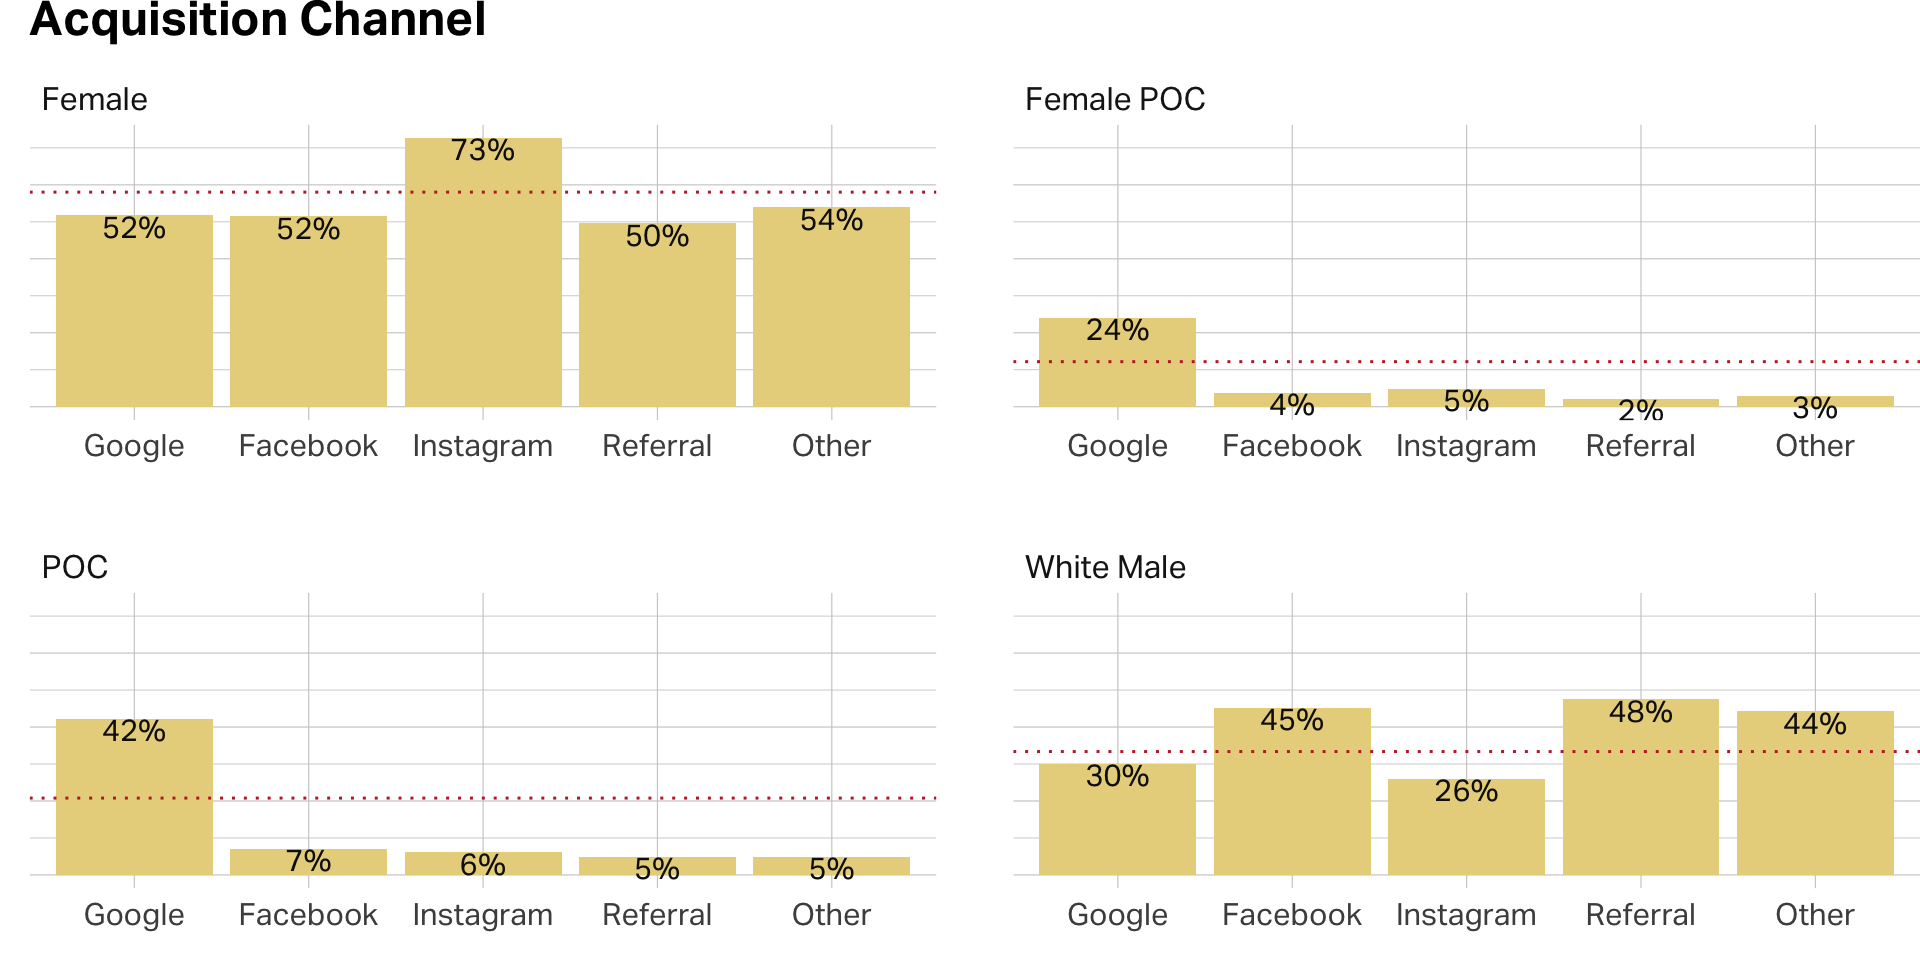
Other purchase drivers by demo
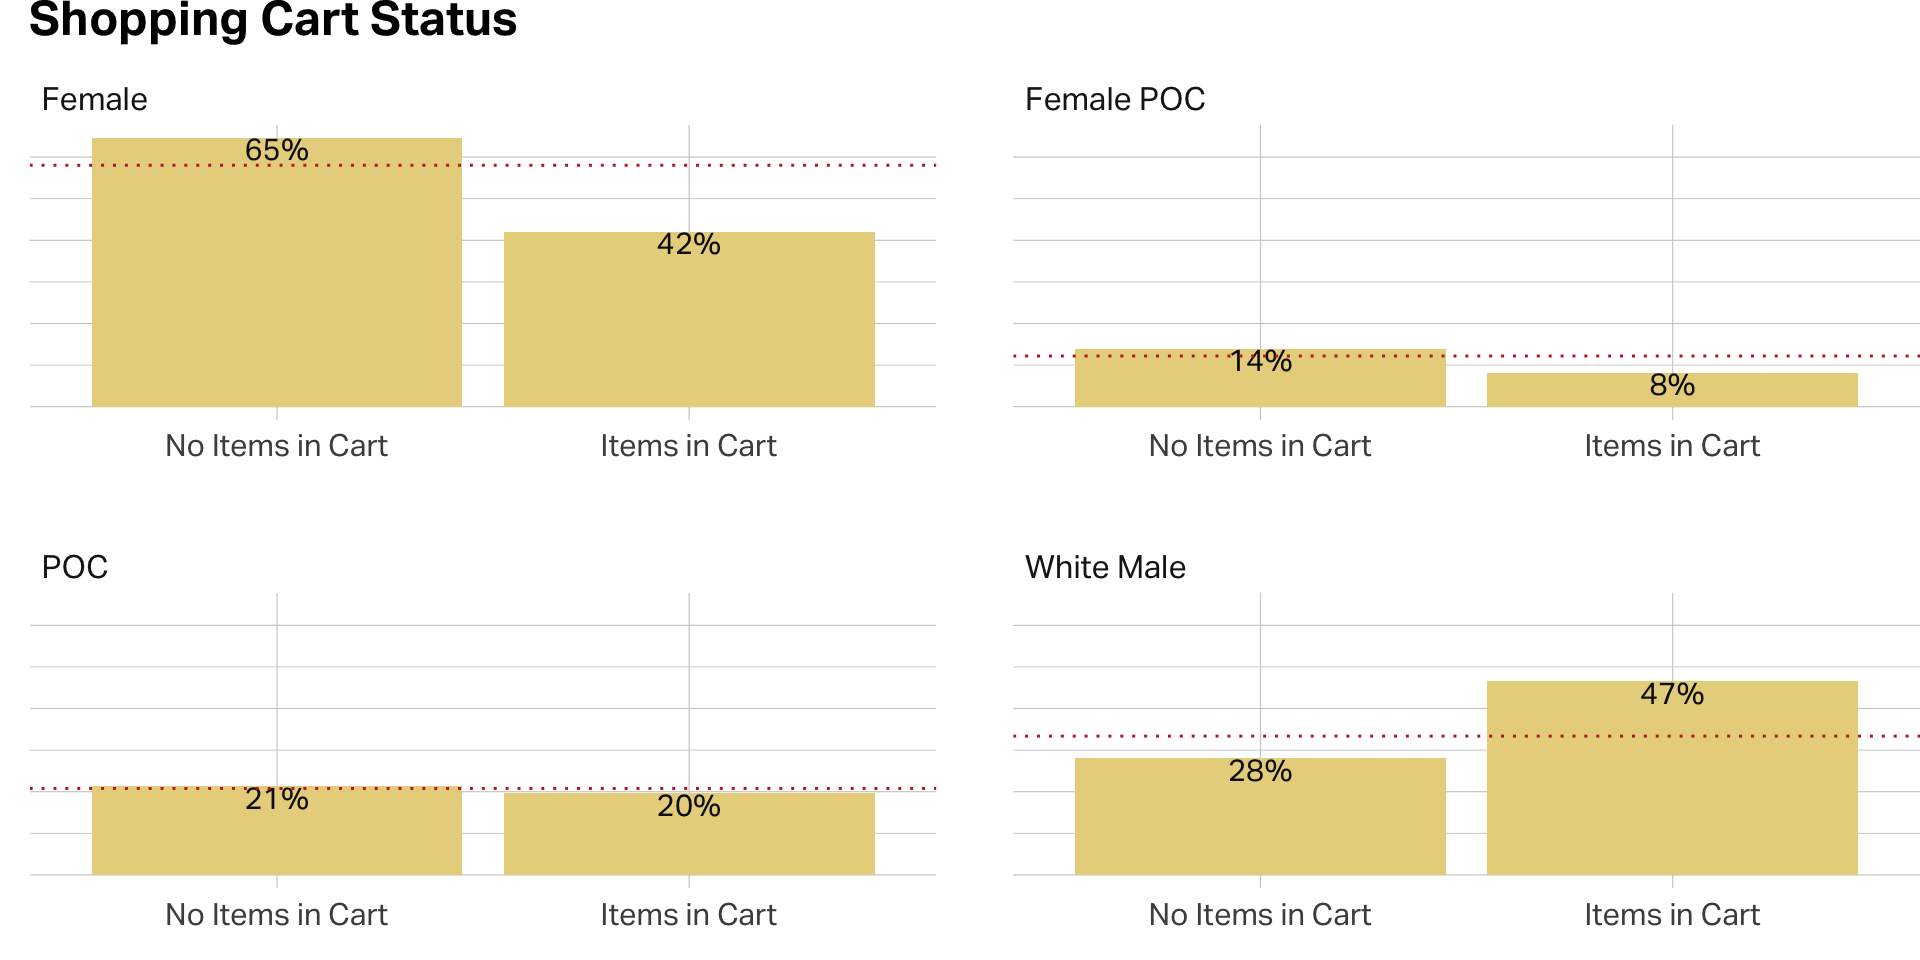
Shopping behavior
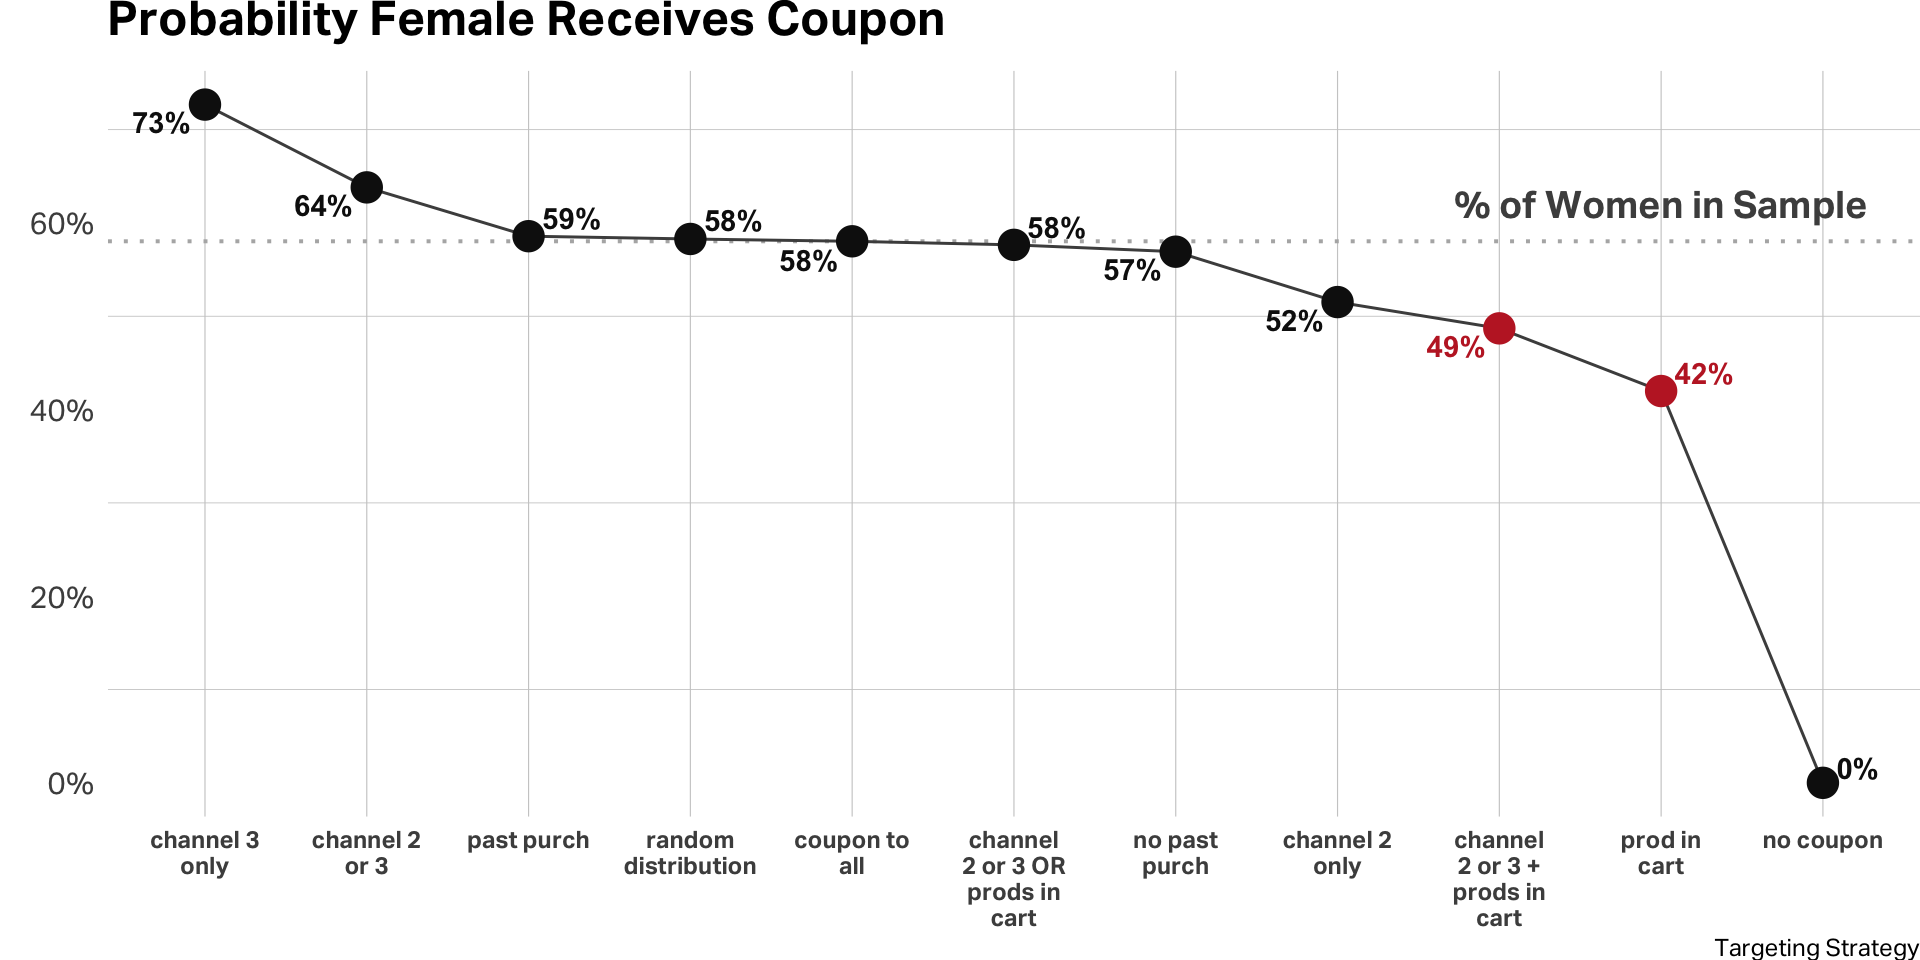
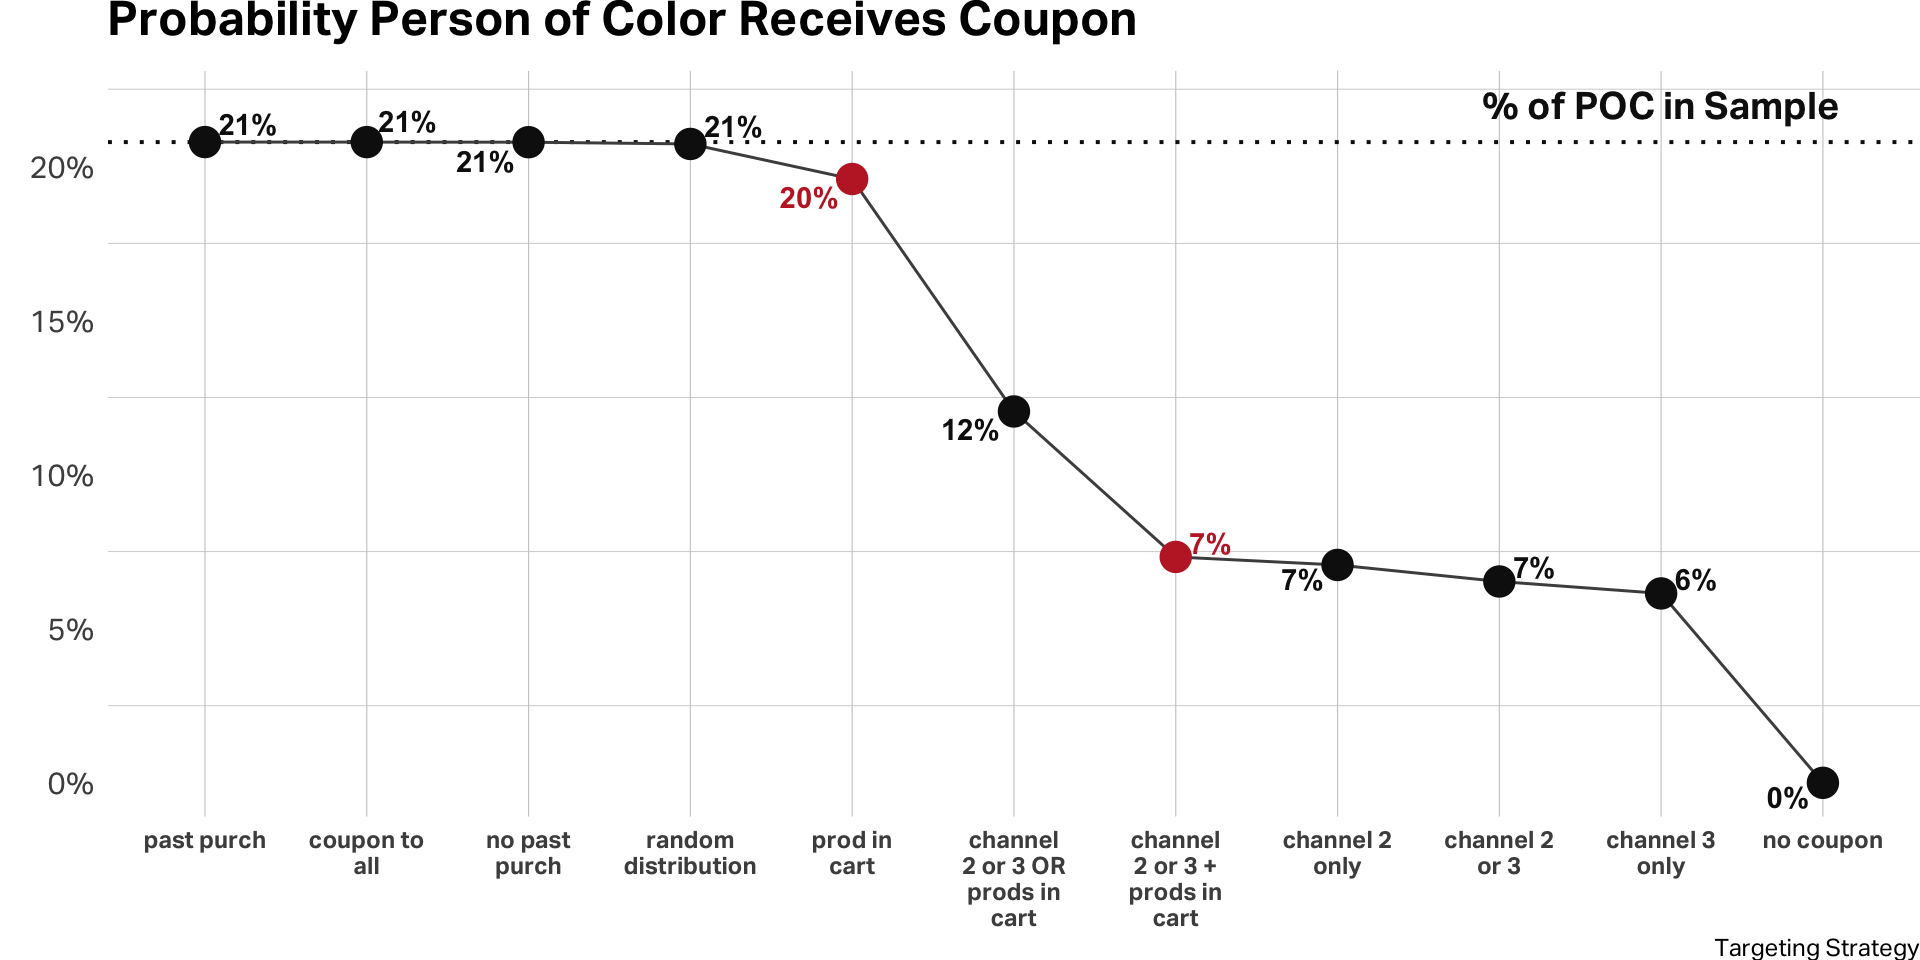
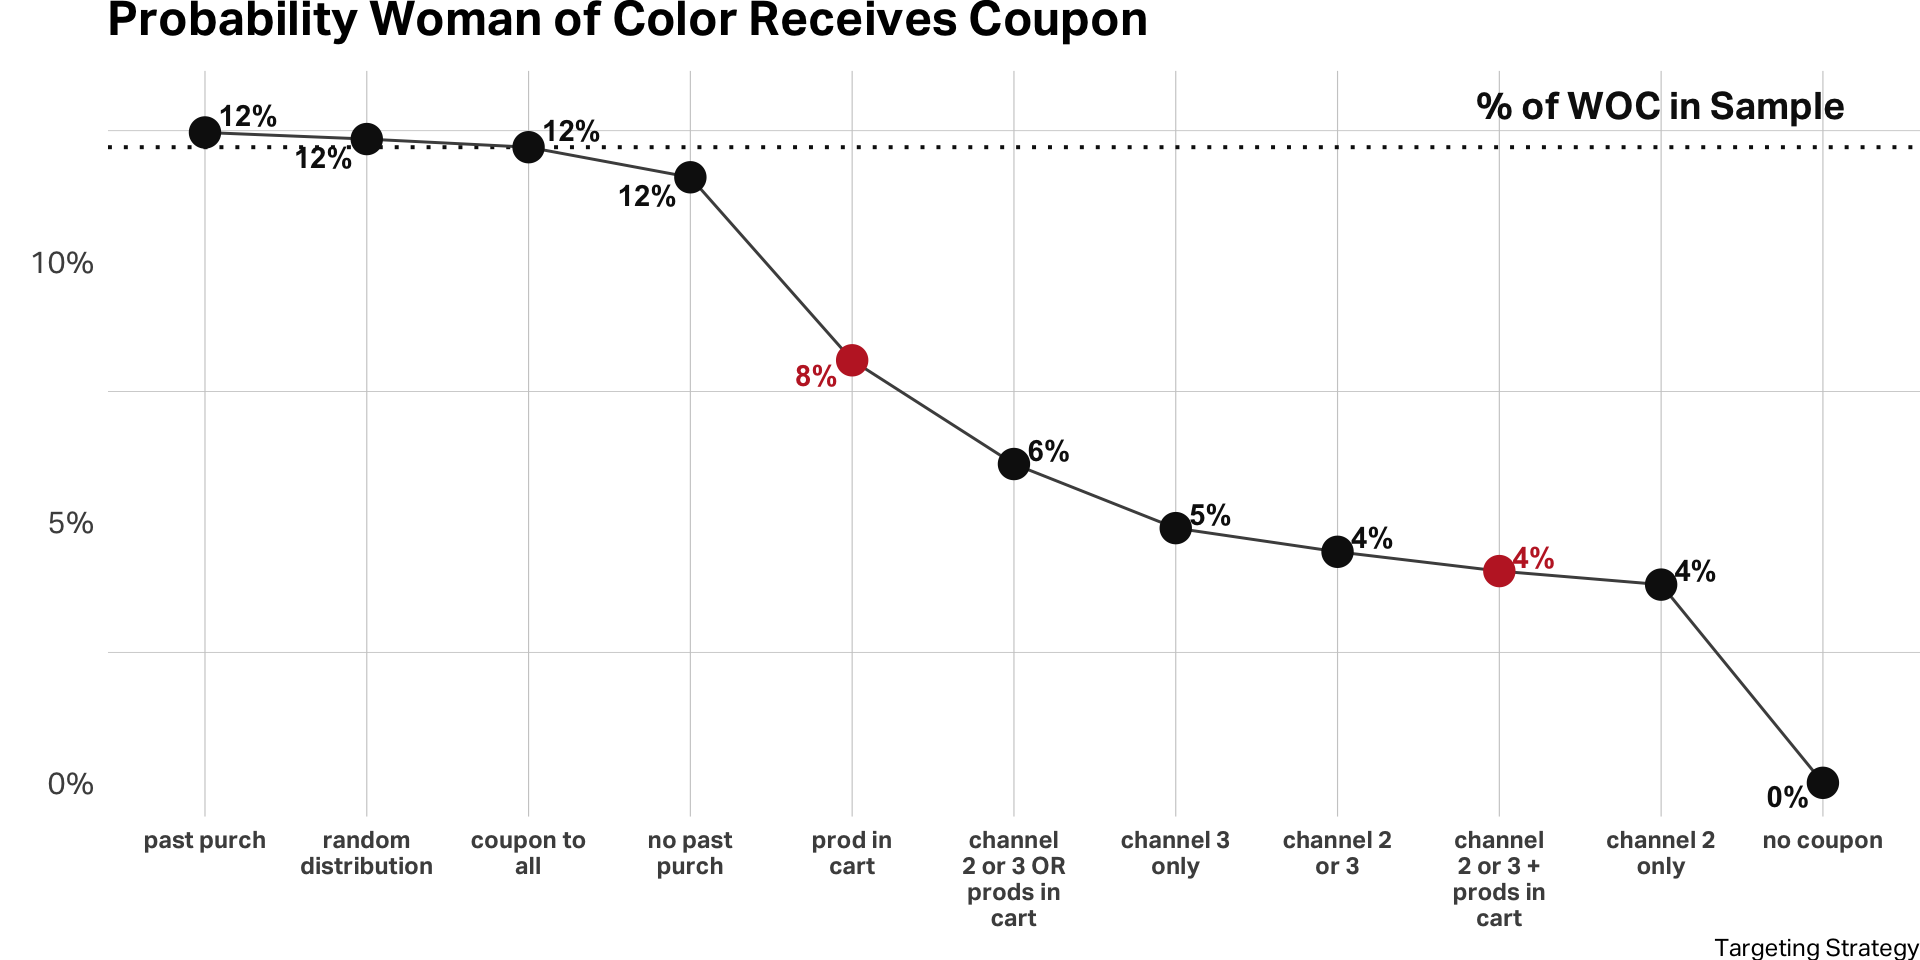
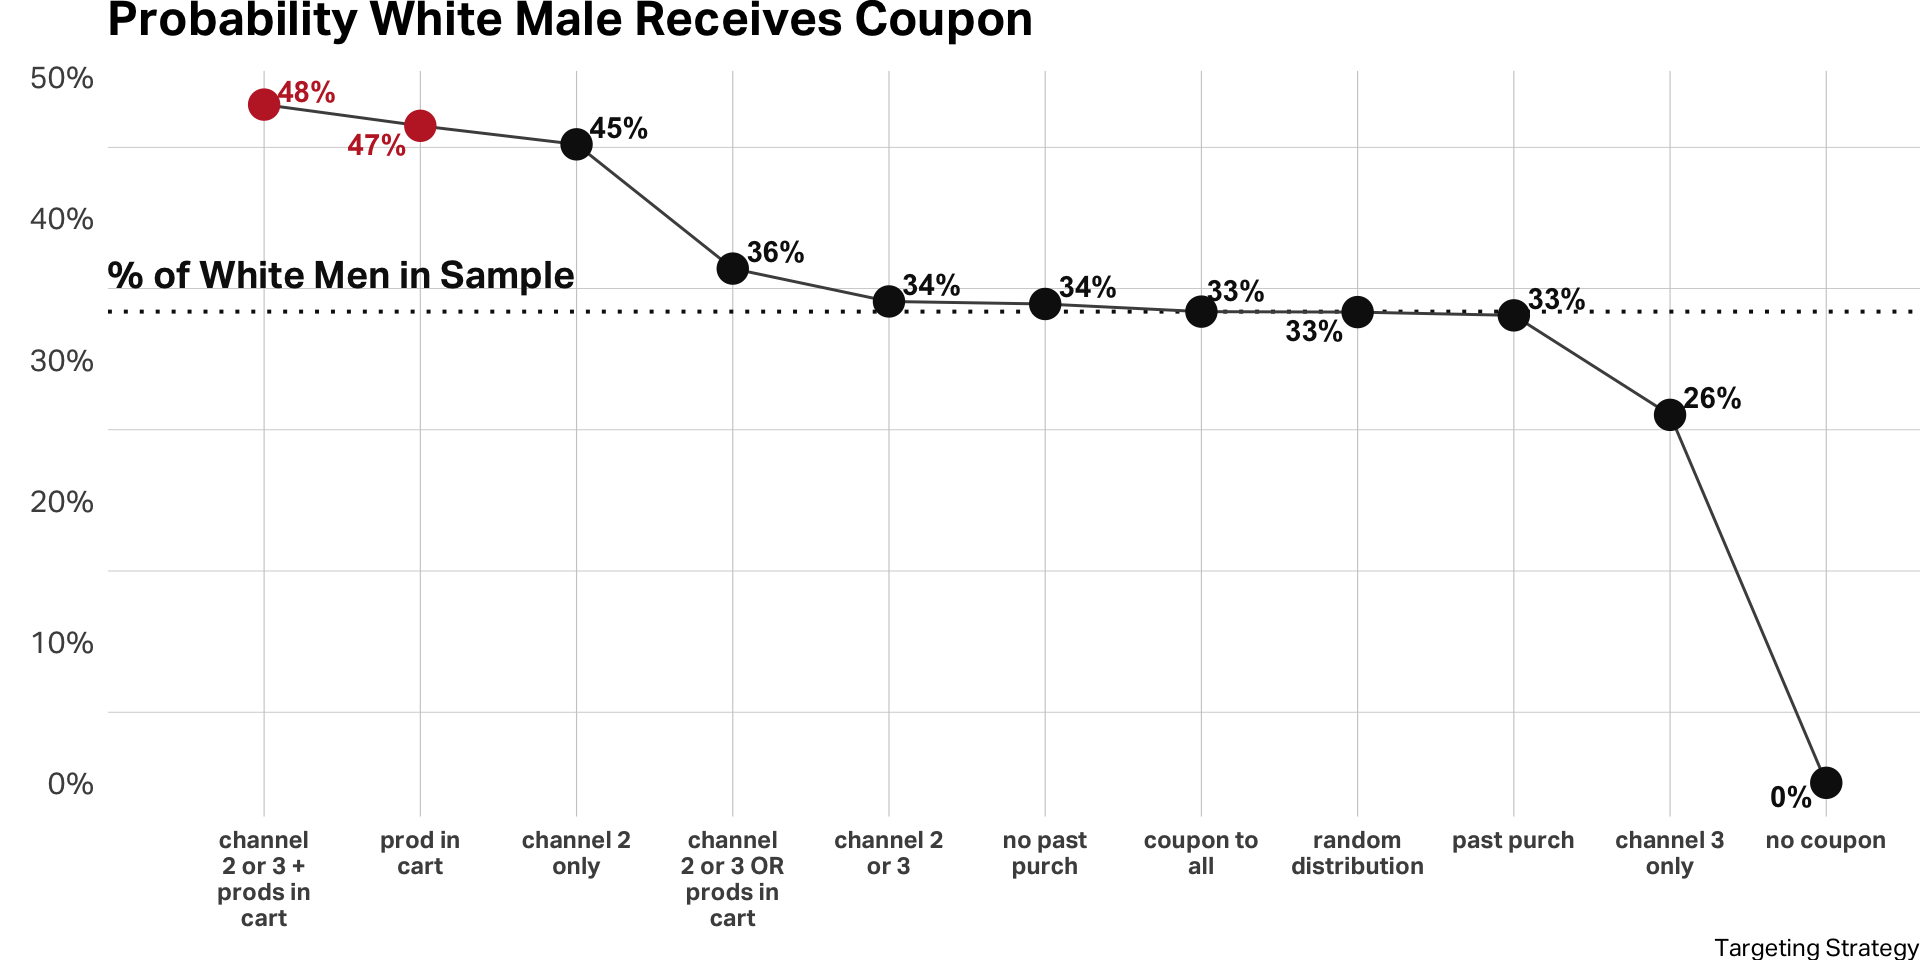
Algorithmic bias
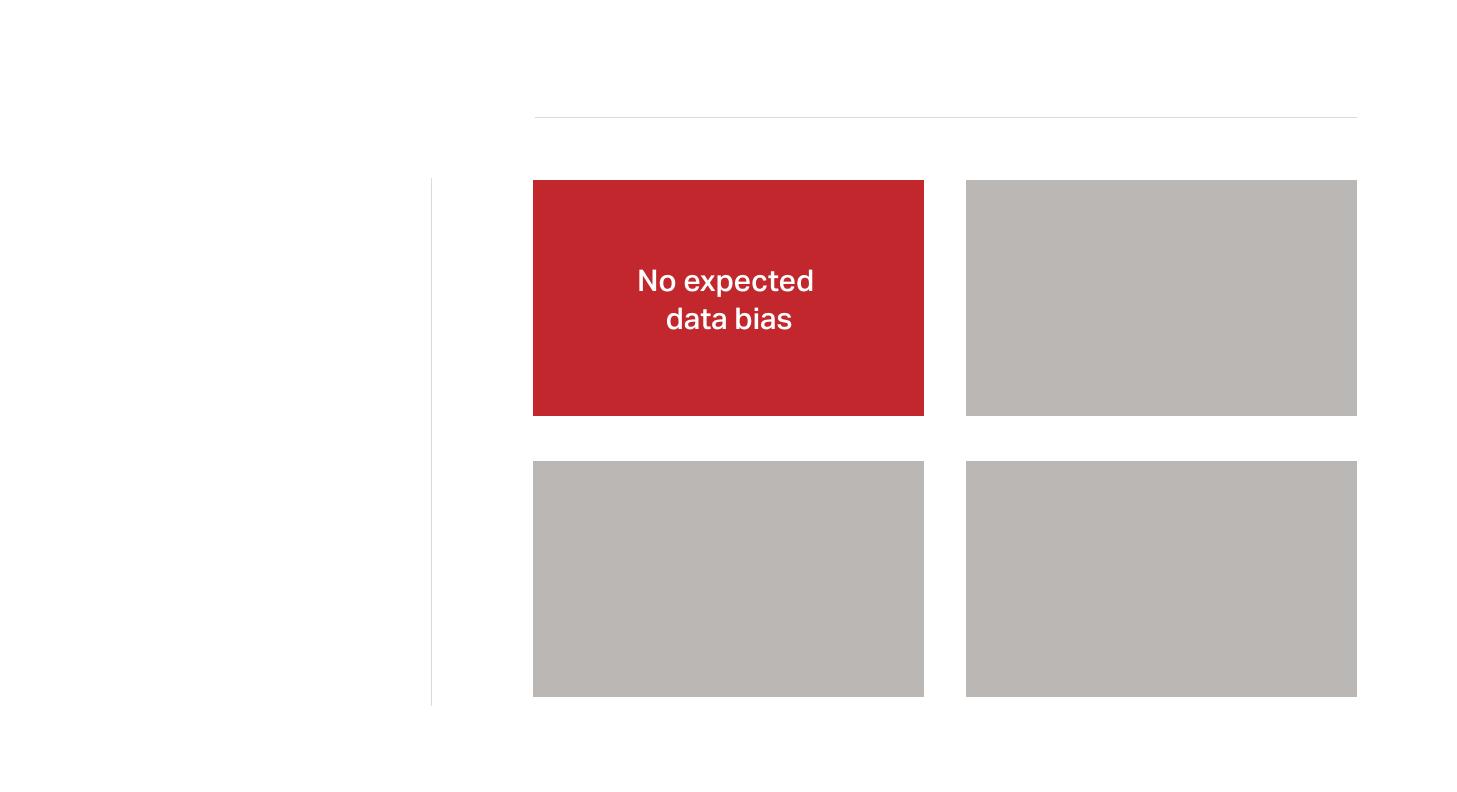
Algorithmic bias
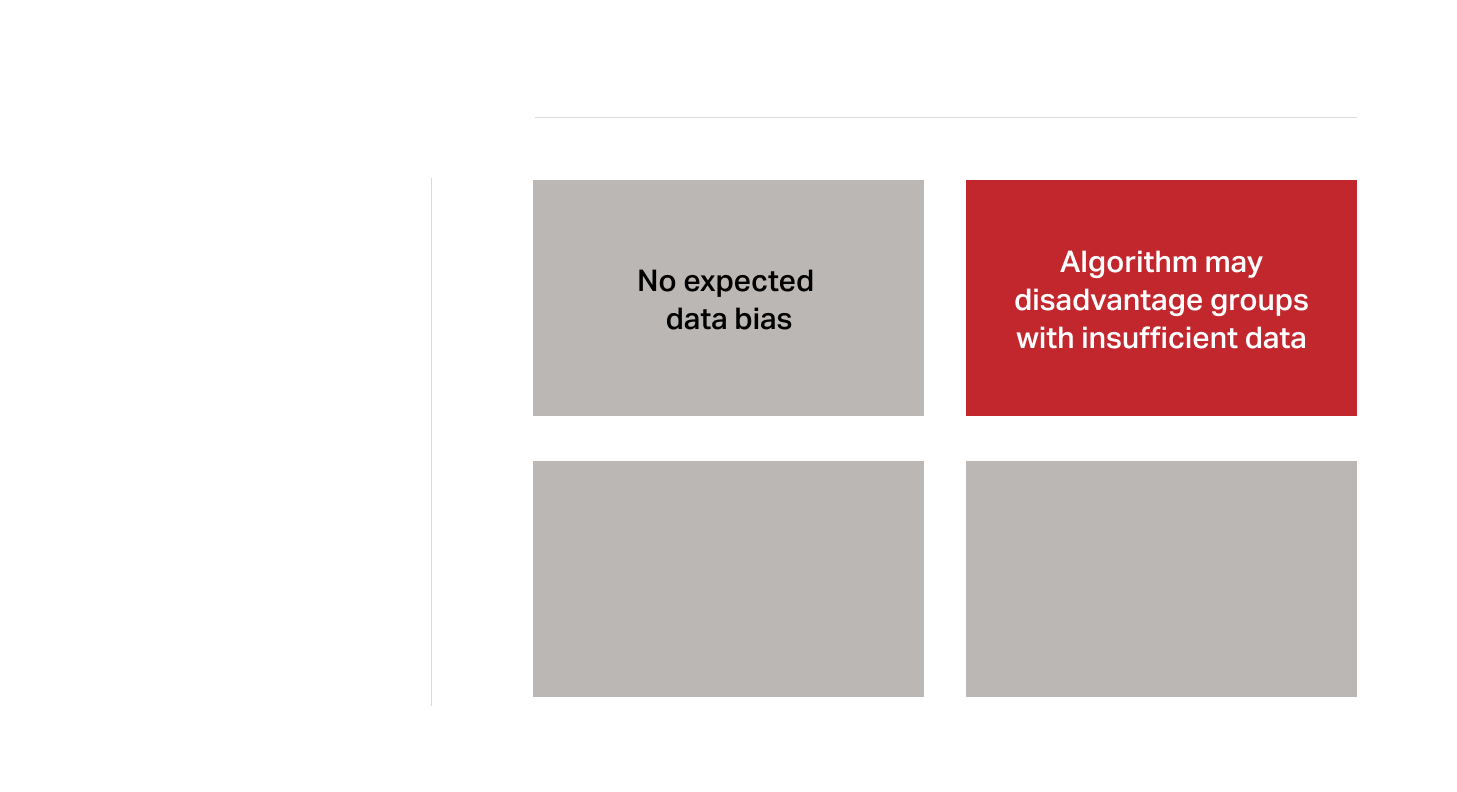
Algorithmic bias
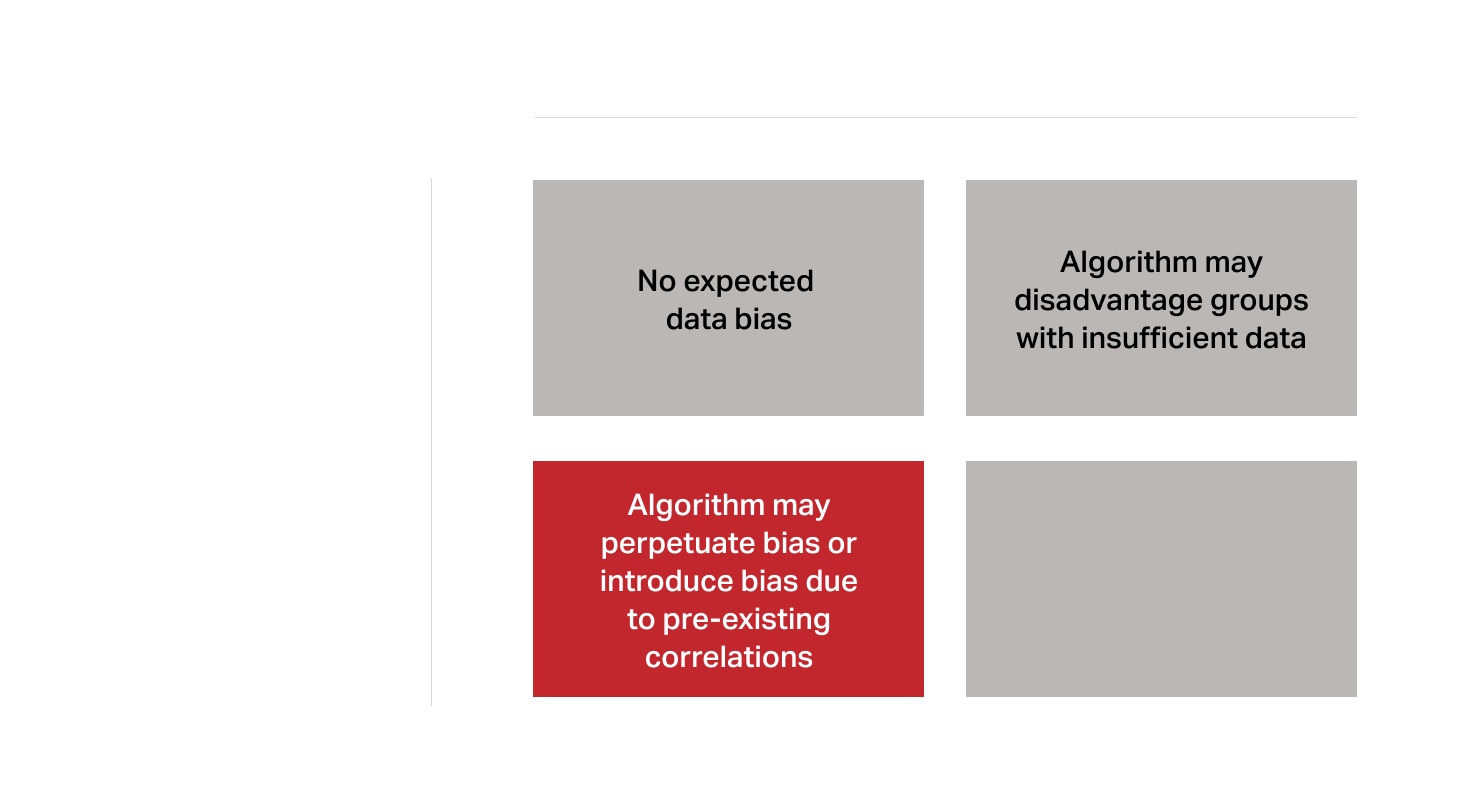
Algorithmic bias
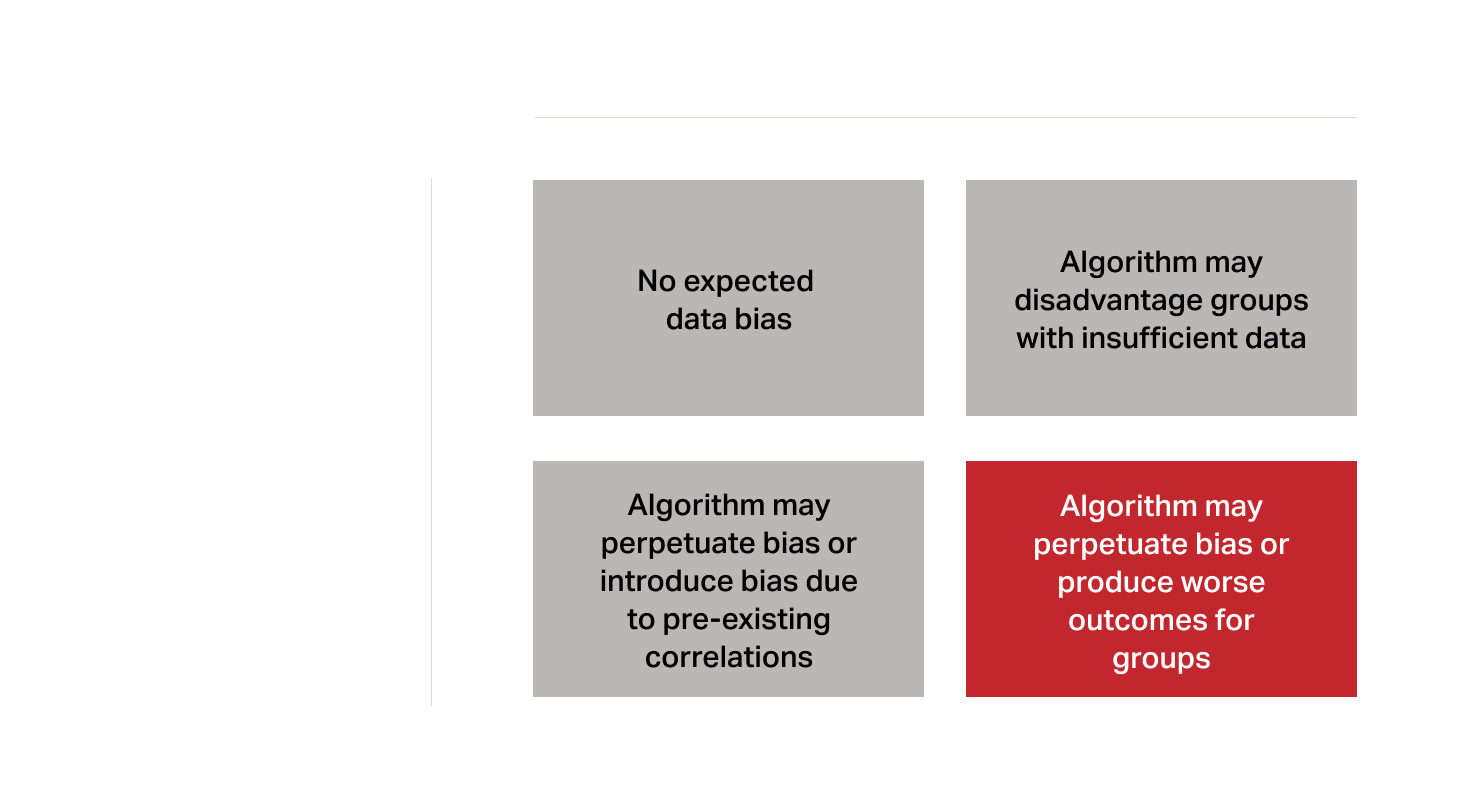
Algorithmic bias

