| Period | State 1 | State 2 | State 3 | State 4+ | m | Expected | PV |
|---|---|---|---|---|---|---|---|
| 1 | 1.00 | 0.00 | 0.00 | 0.00 | $25 | $25.00 | $24.79 |
| 2 | 0.50 | 0.50 | 0.00 | 0.00 | $25 | $12.50 | $12.29 |
| 3 | 0.35 | 0.25 | 0.40 | 0.00 | $25 | $8.75 | $8.53 |
| 4 | 0.26 | 0.17 | 0.20 | 0.36 | $25 | $6.62 | $6.41 |
| 5 | 0.19 | 0.13 | 0.14 | 0.54 | $25 | $4.69 | $4.50 |
| 6 | 0.13 | 0.09 | 0.11 | 0.67 | $25 | $3.36 | $3.19 |
| 7 | 0.10 | 0.07 | 0.08 | 0.76 | $25 | $2.41 | $2.28 |
| 8 | 0.07 | 0.05 | 0.05 | 0.83 | $25 | $1.73 | $1.62 |
| 9 | 0.05 | 0.03 | 0.04 | 0.88 | $25 | $1.24 | $1.15 |
| 10 | 0.04 | 0.02 | 0.03 | 0.91 | $25 | $0.89 | $0.82 |
| 11 | 0.03 | 0.02 | 0.02 | 0.94 | $25 | $0.64 | $0.58 |
| 12 | 0.02 | 0.01 | 0.01 | 0.95 | $25 | $0.46 | $0.41 |
| Total | $66.58 |
CLV and Research Planning
Overview
Linking customer value to research objectives and designs.
Presented to:
MKT 512
September 4, 2025
MKT 512
September 4, 2025

Ratios

Delta analysis

Hands-on
Delta analysis

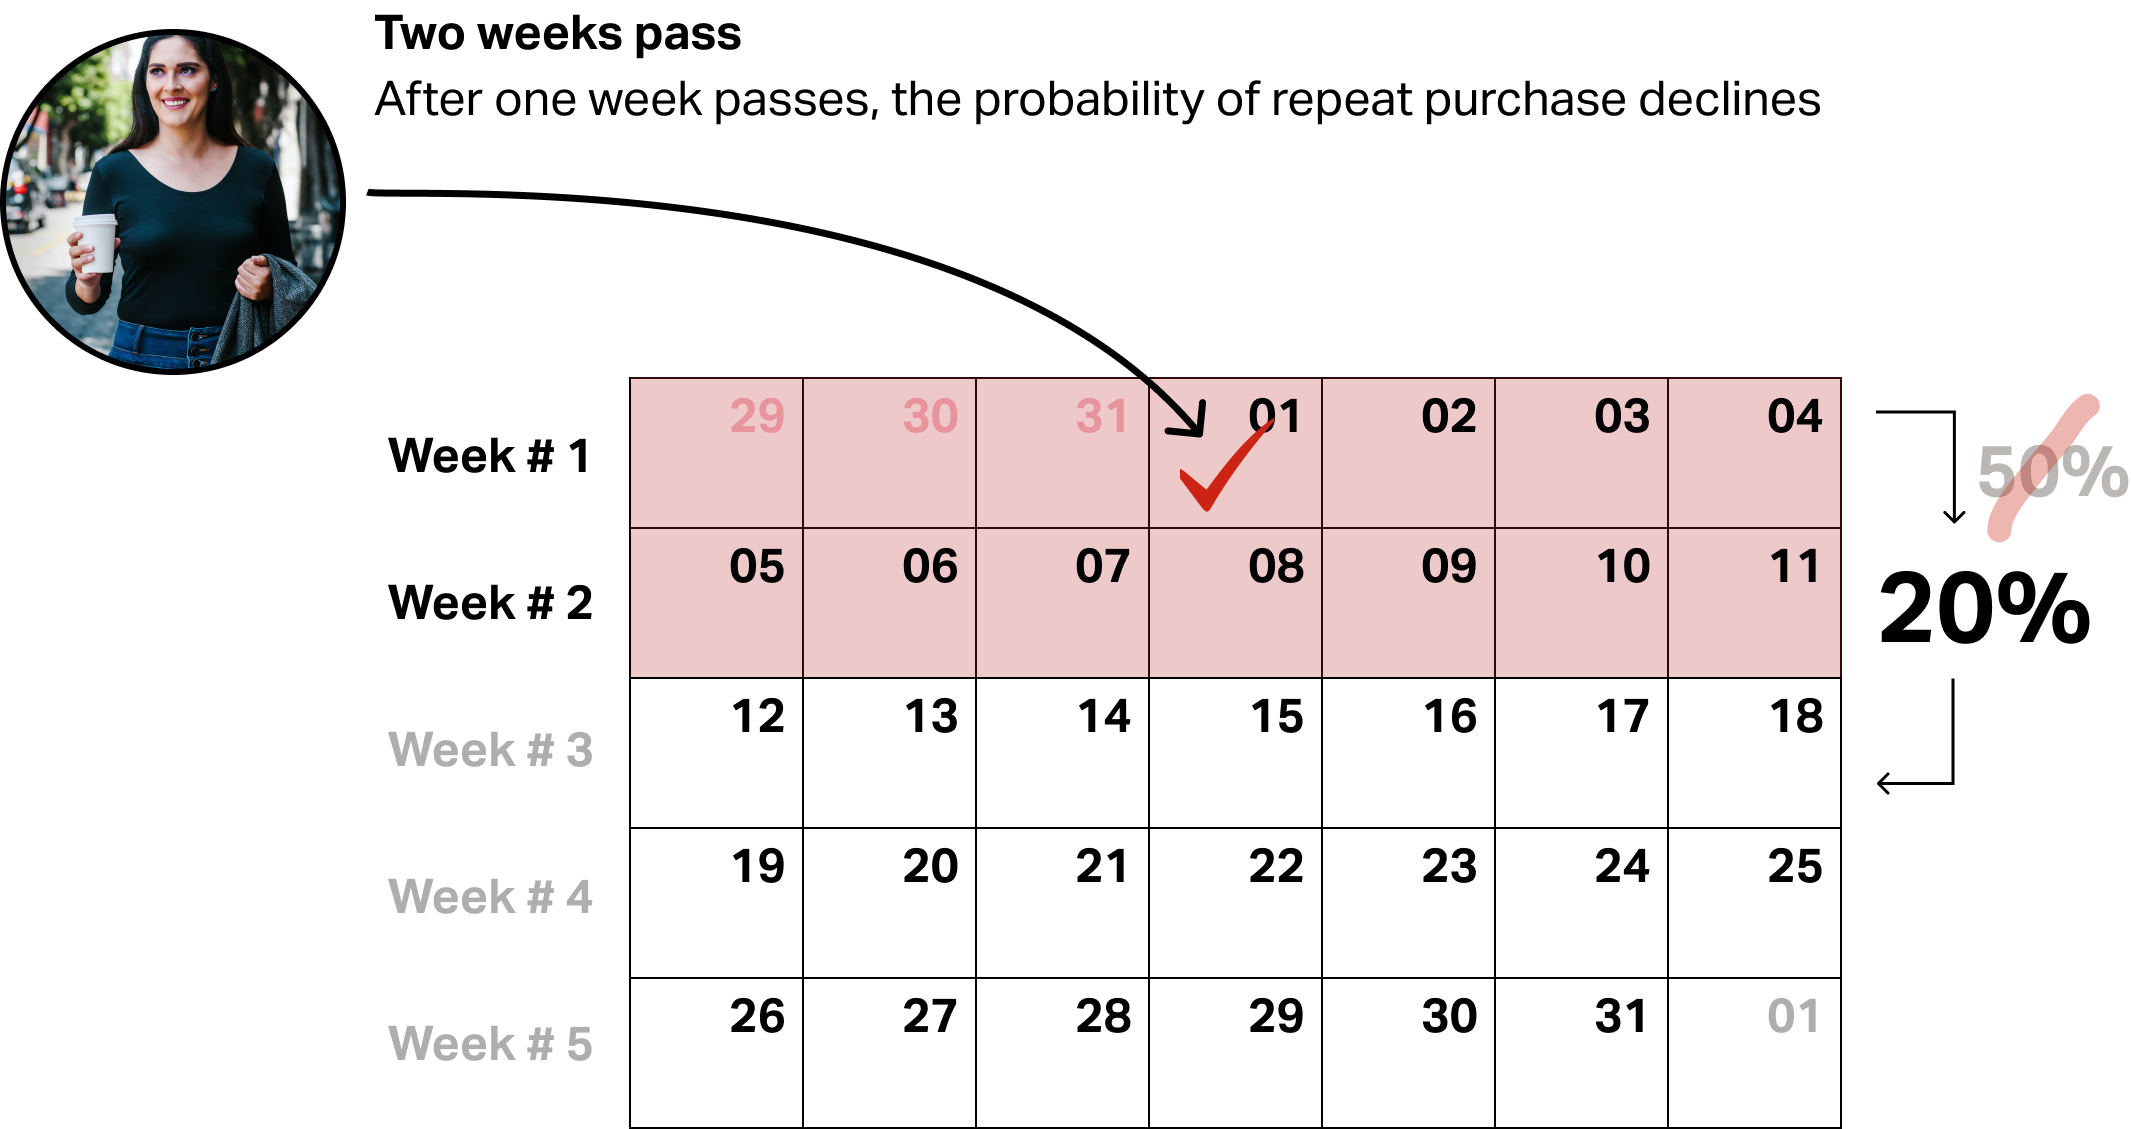
So far, we’ve been discussing uniform churn risk.
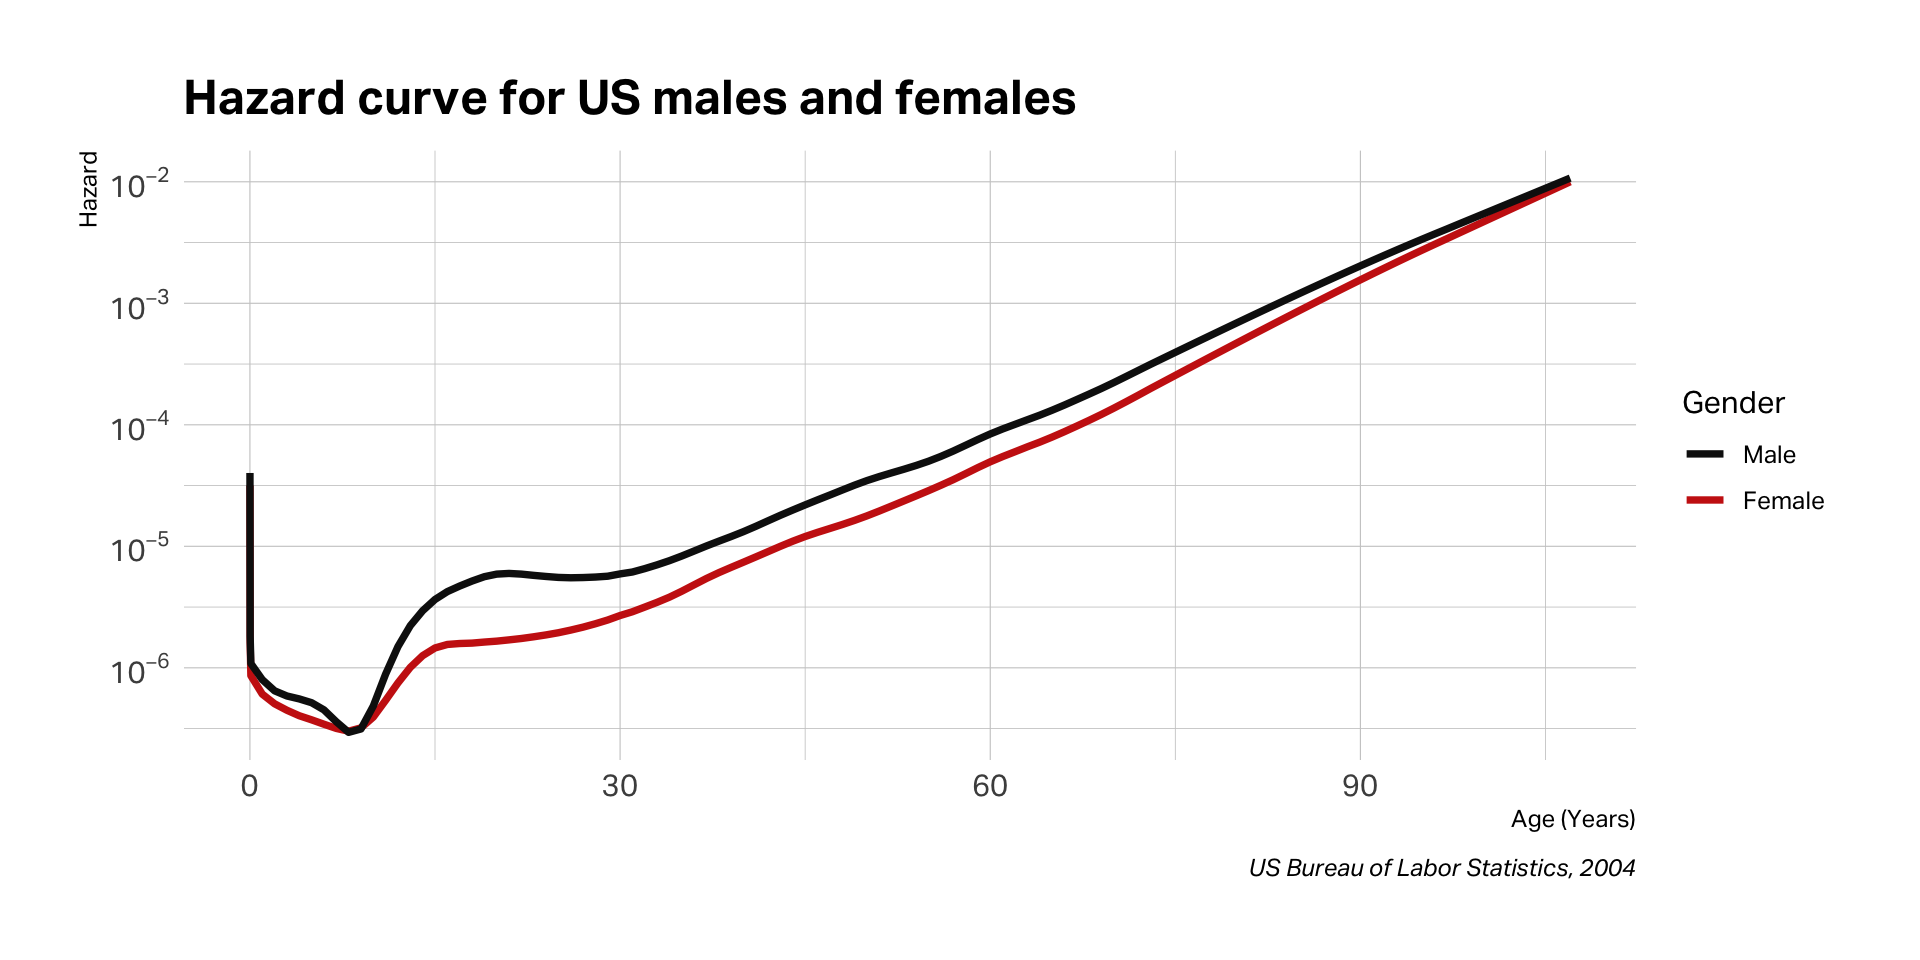
Survival analysis translation

A real-world example
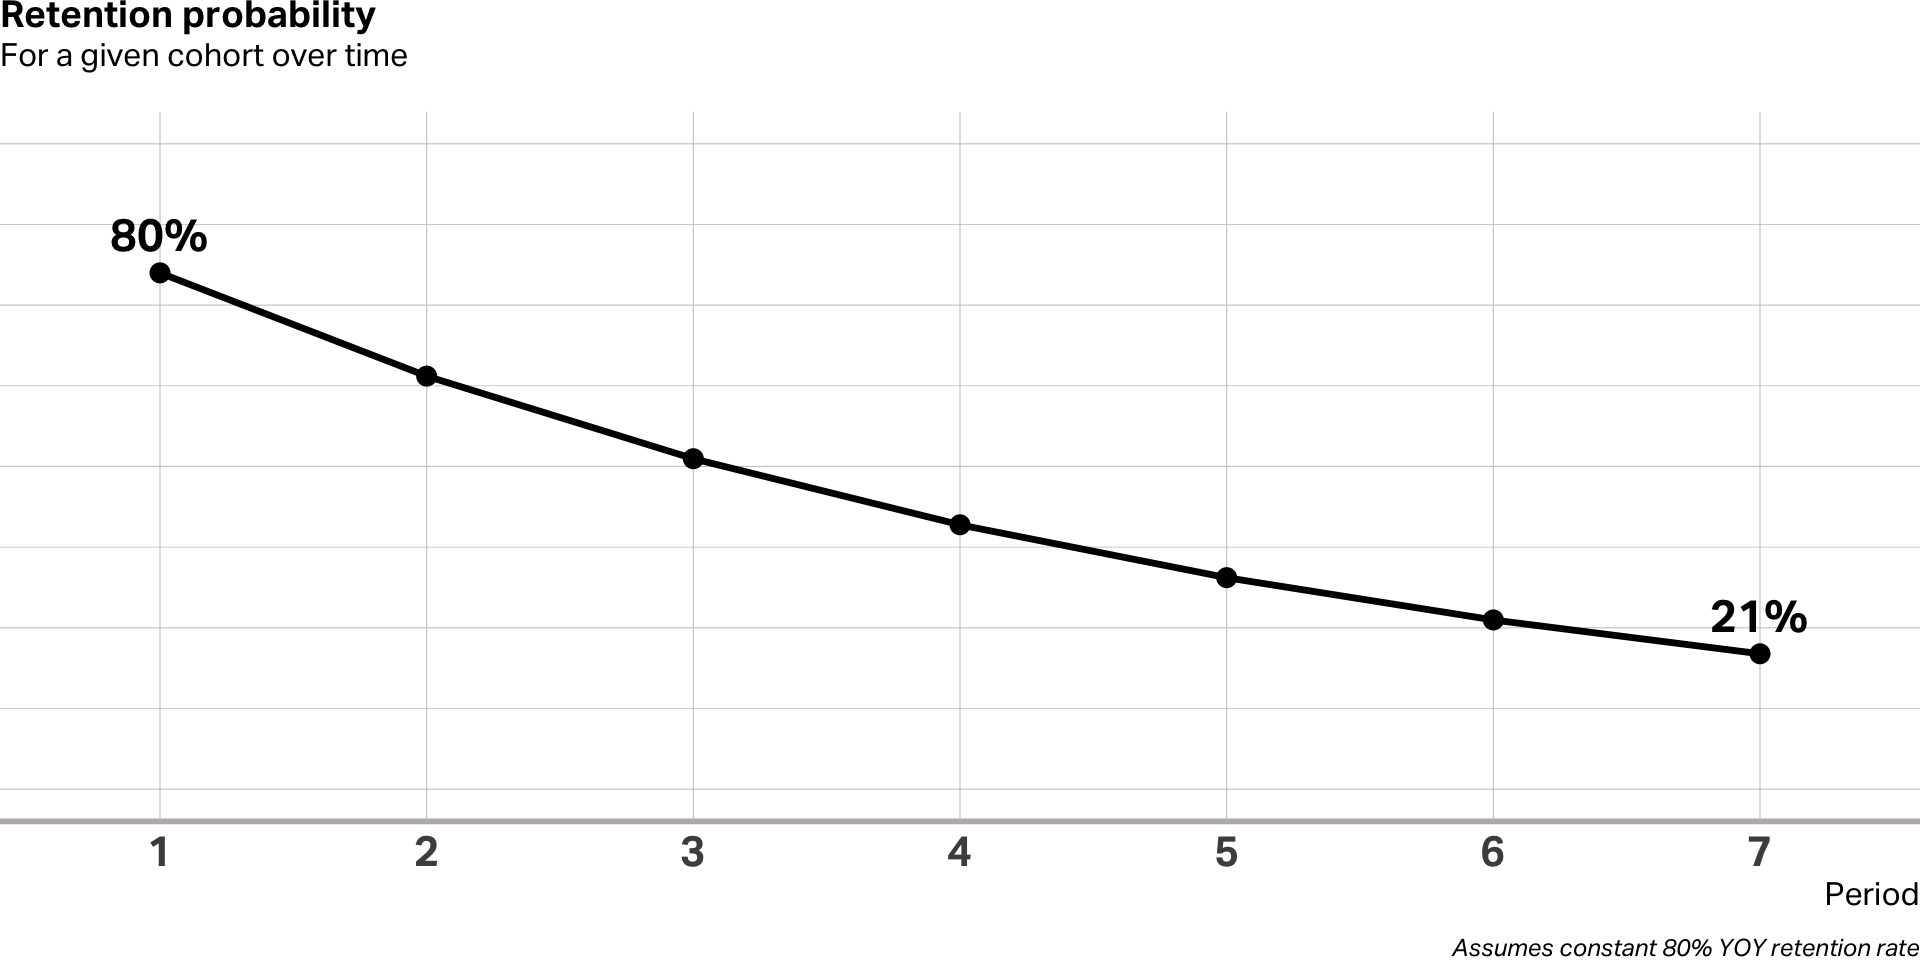
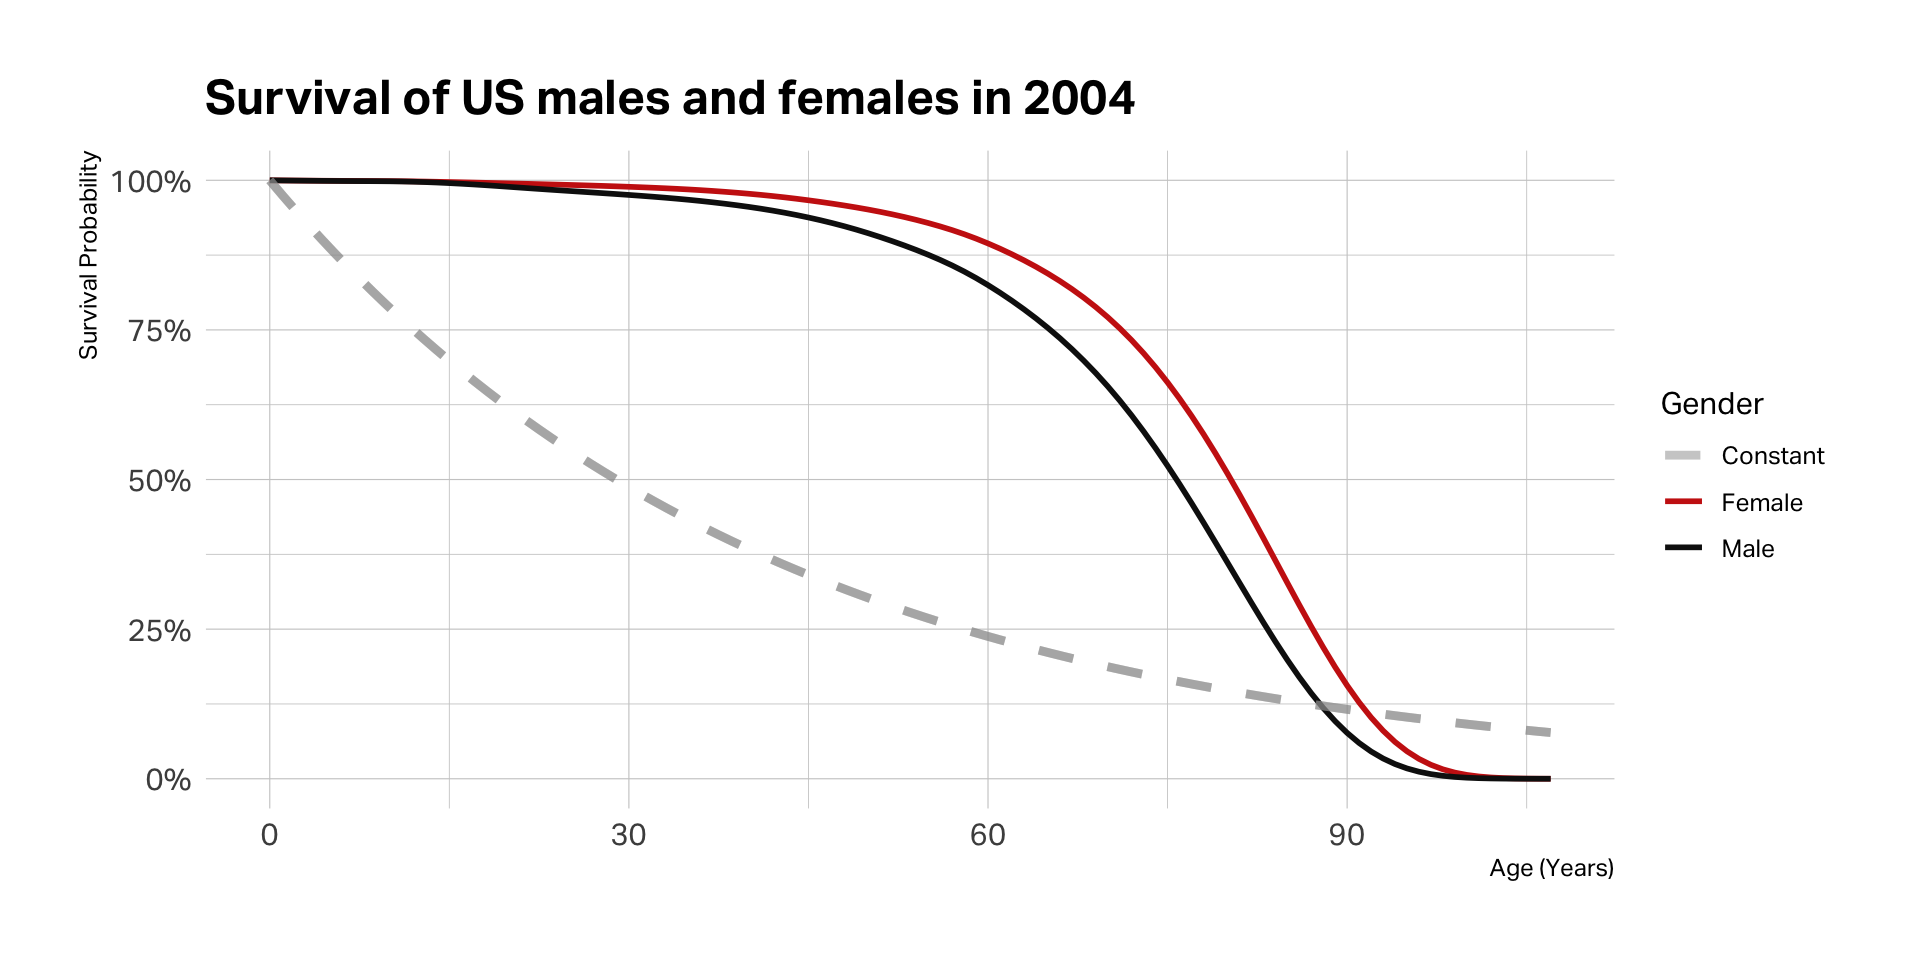
Survival rates
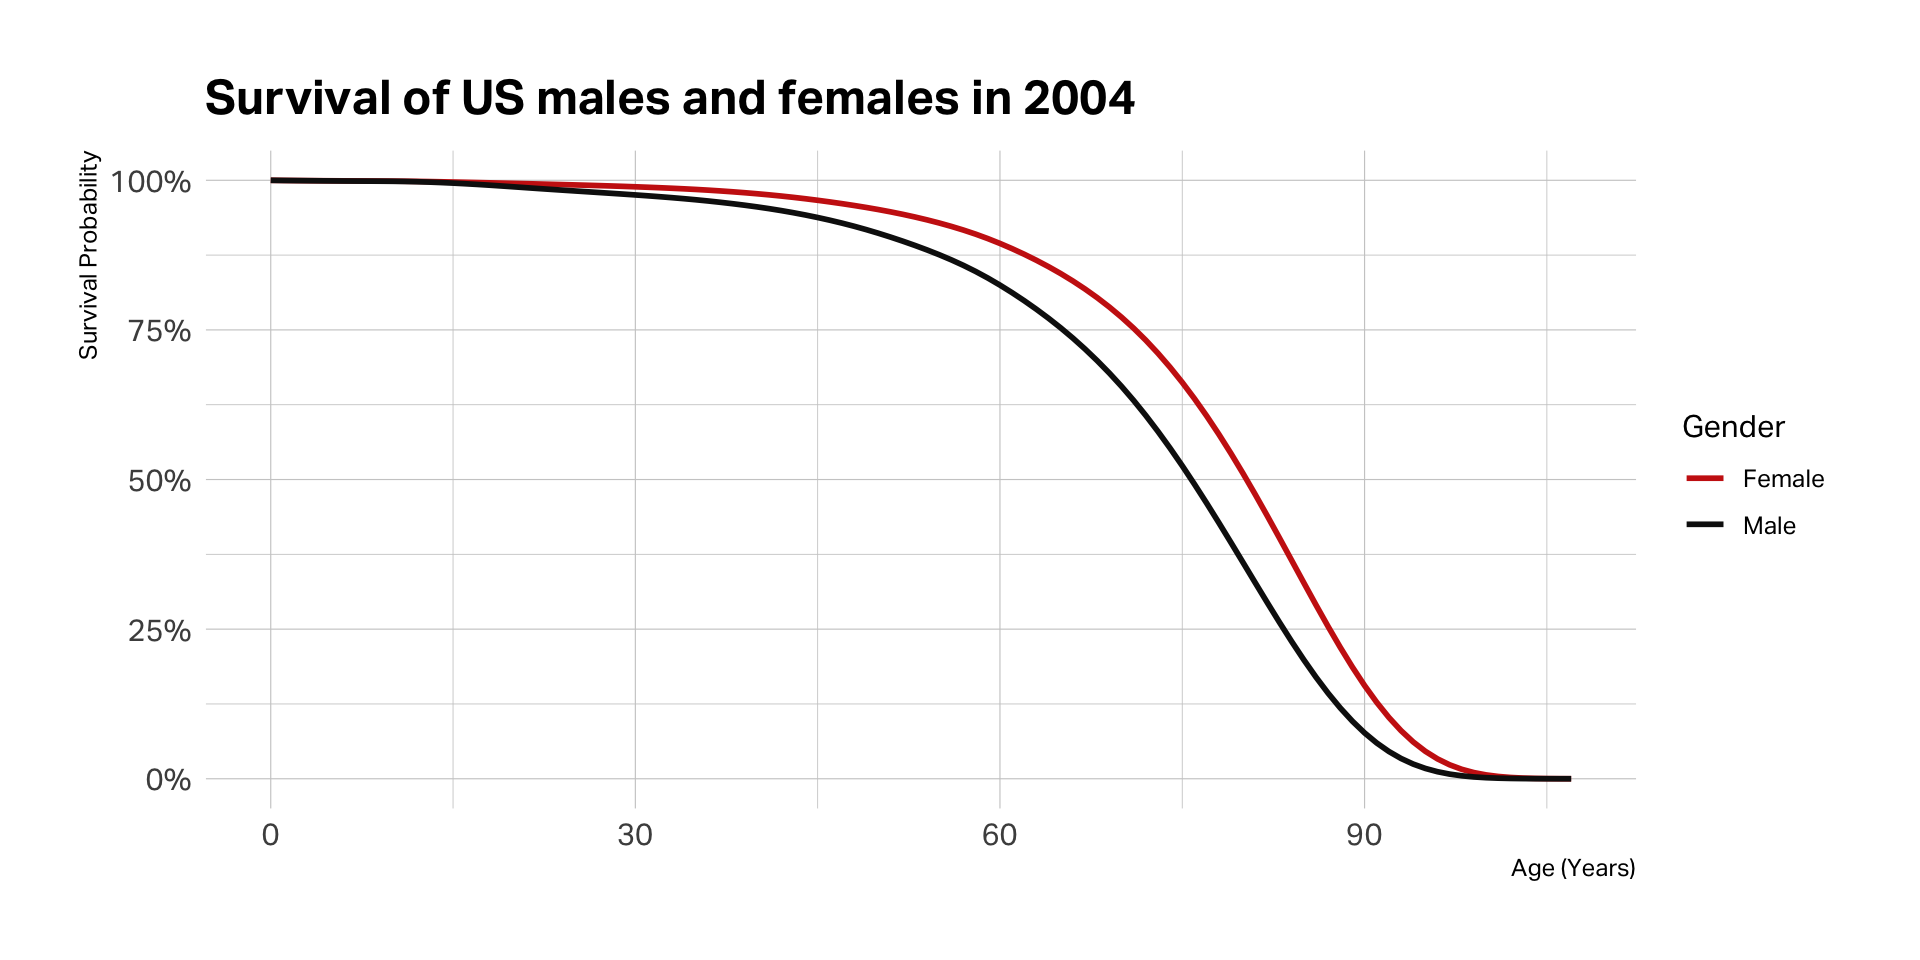
Calculating survival
Had we estimated with constant rate based on those who actually reached age 90, we would have grossly over-estimated premature death.
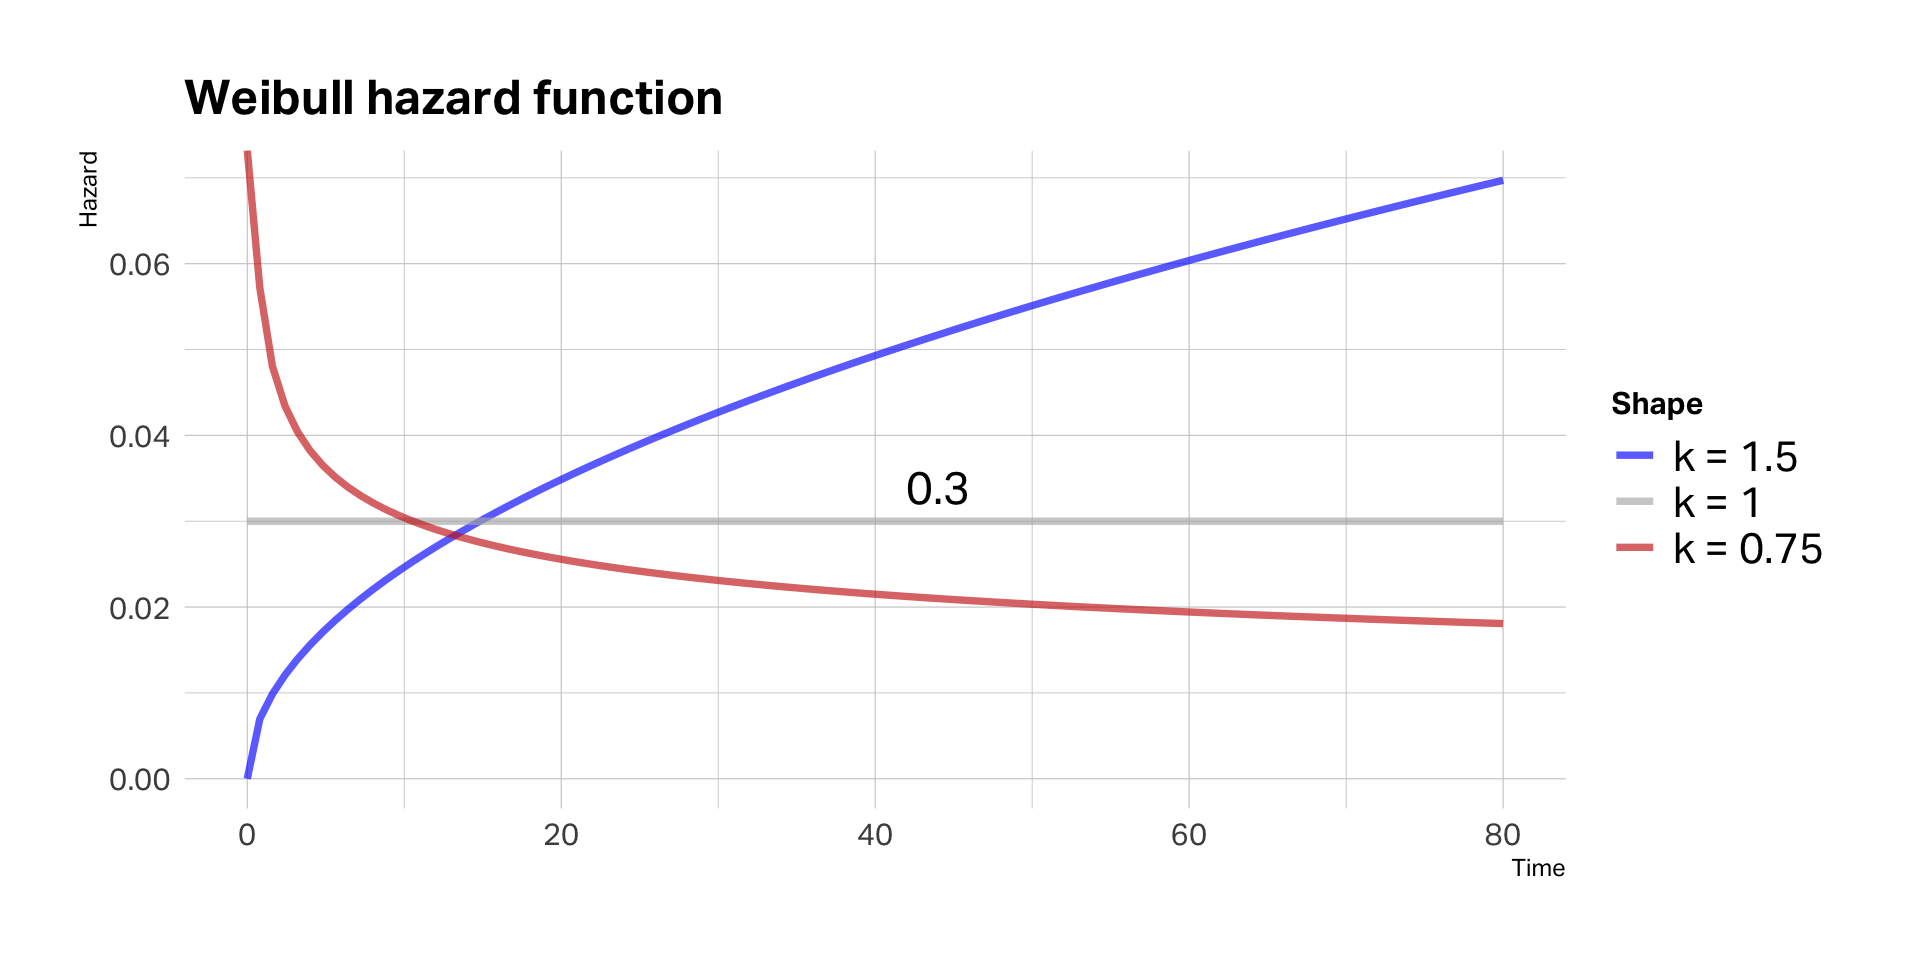
Shape matters
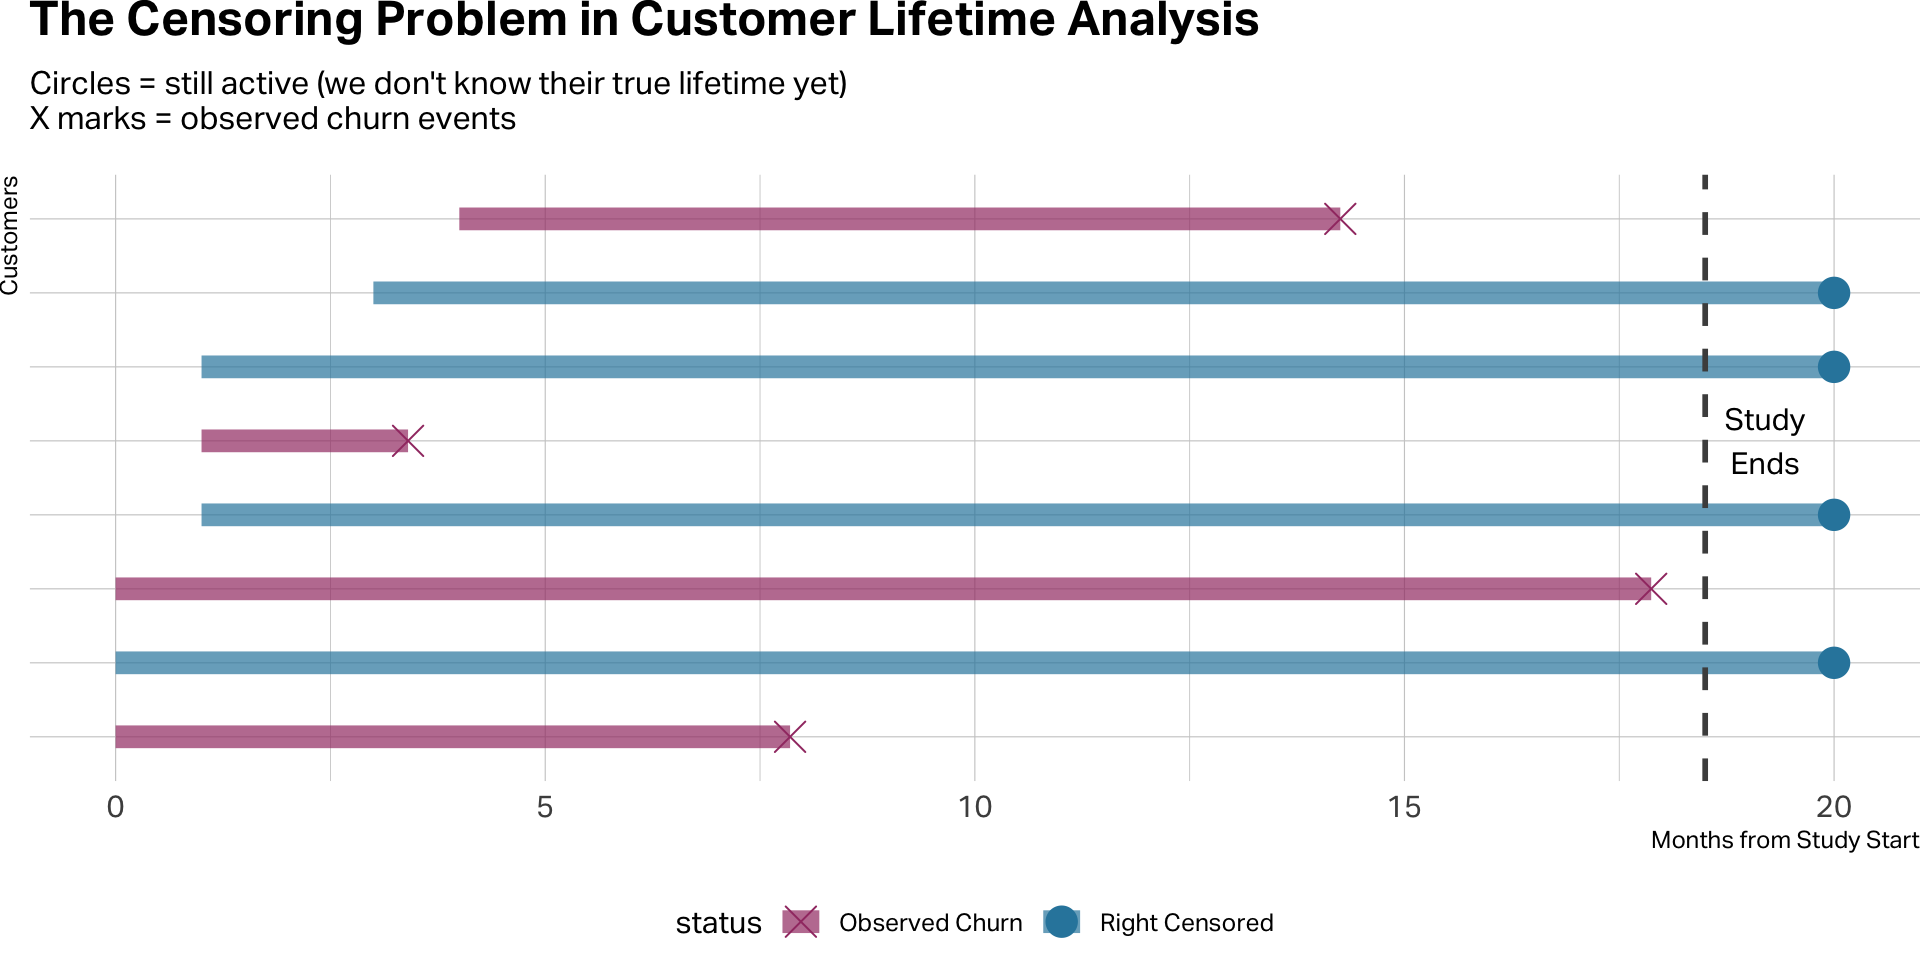
Censoring
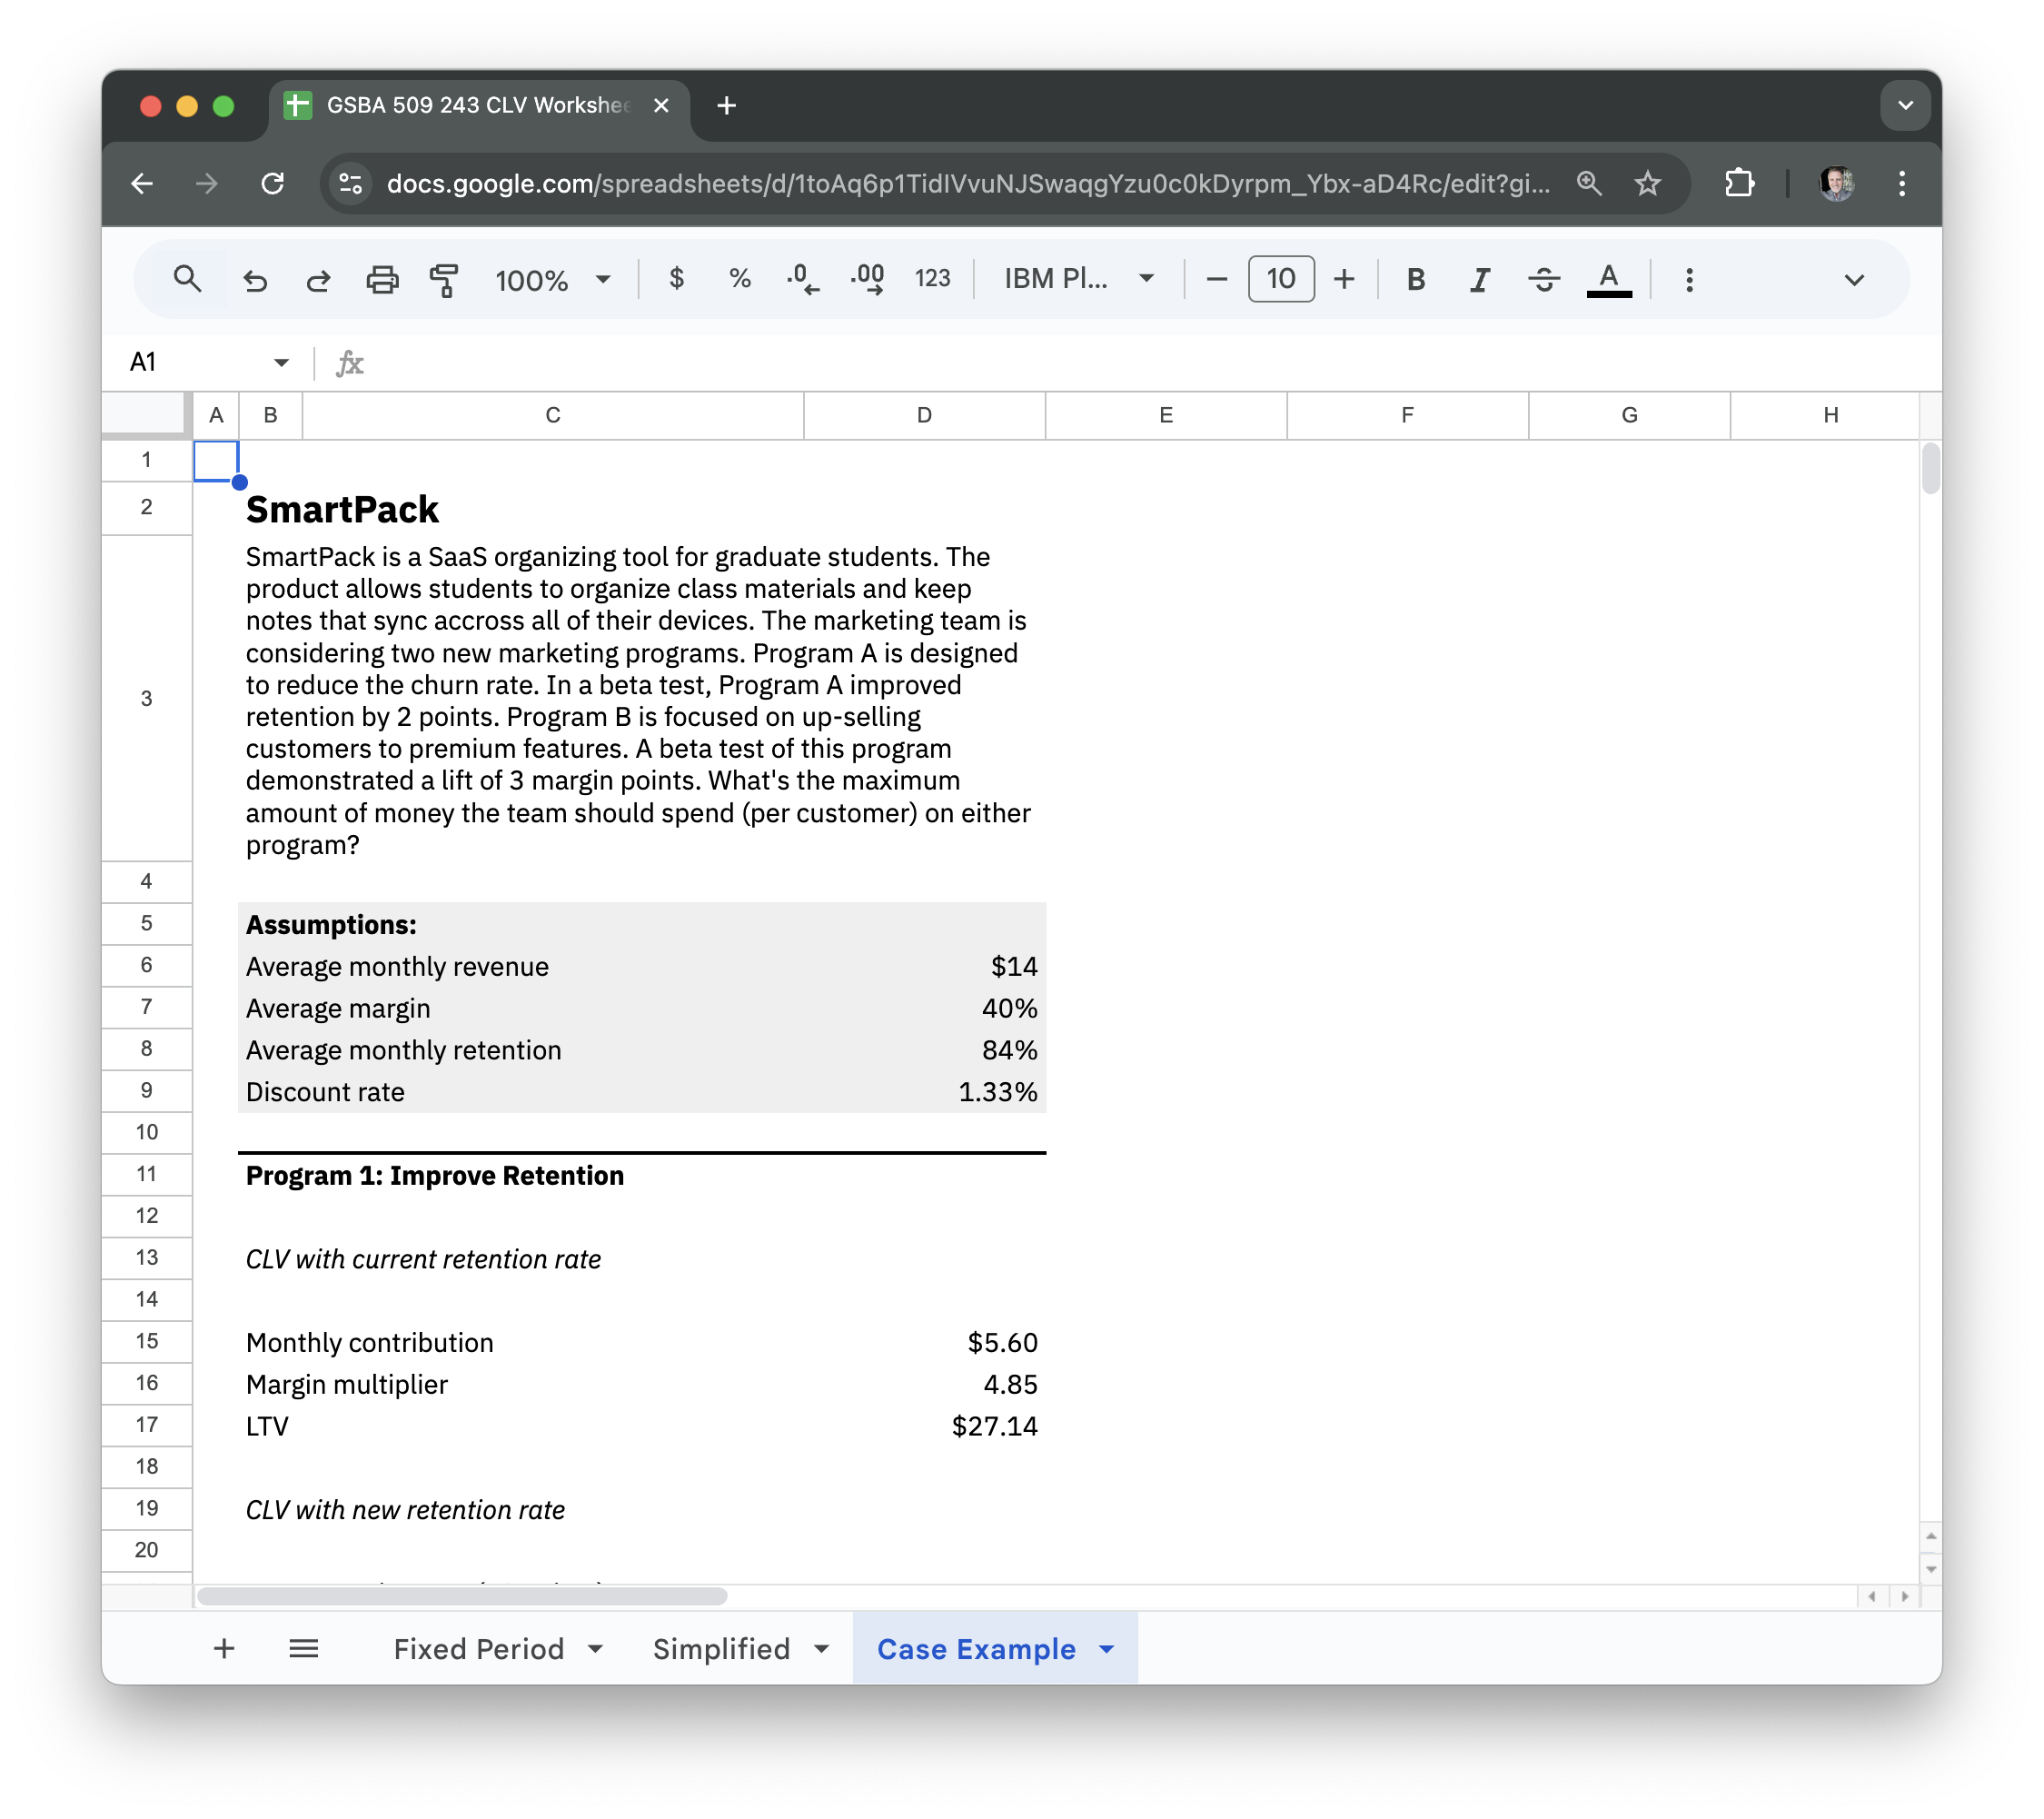
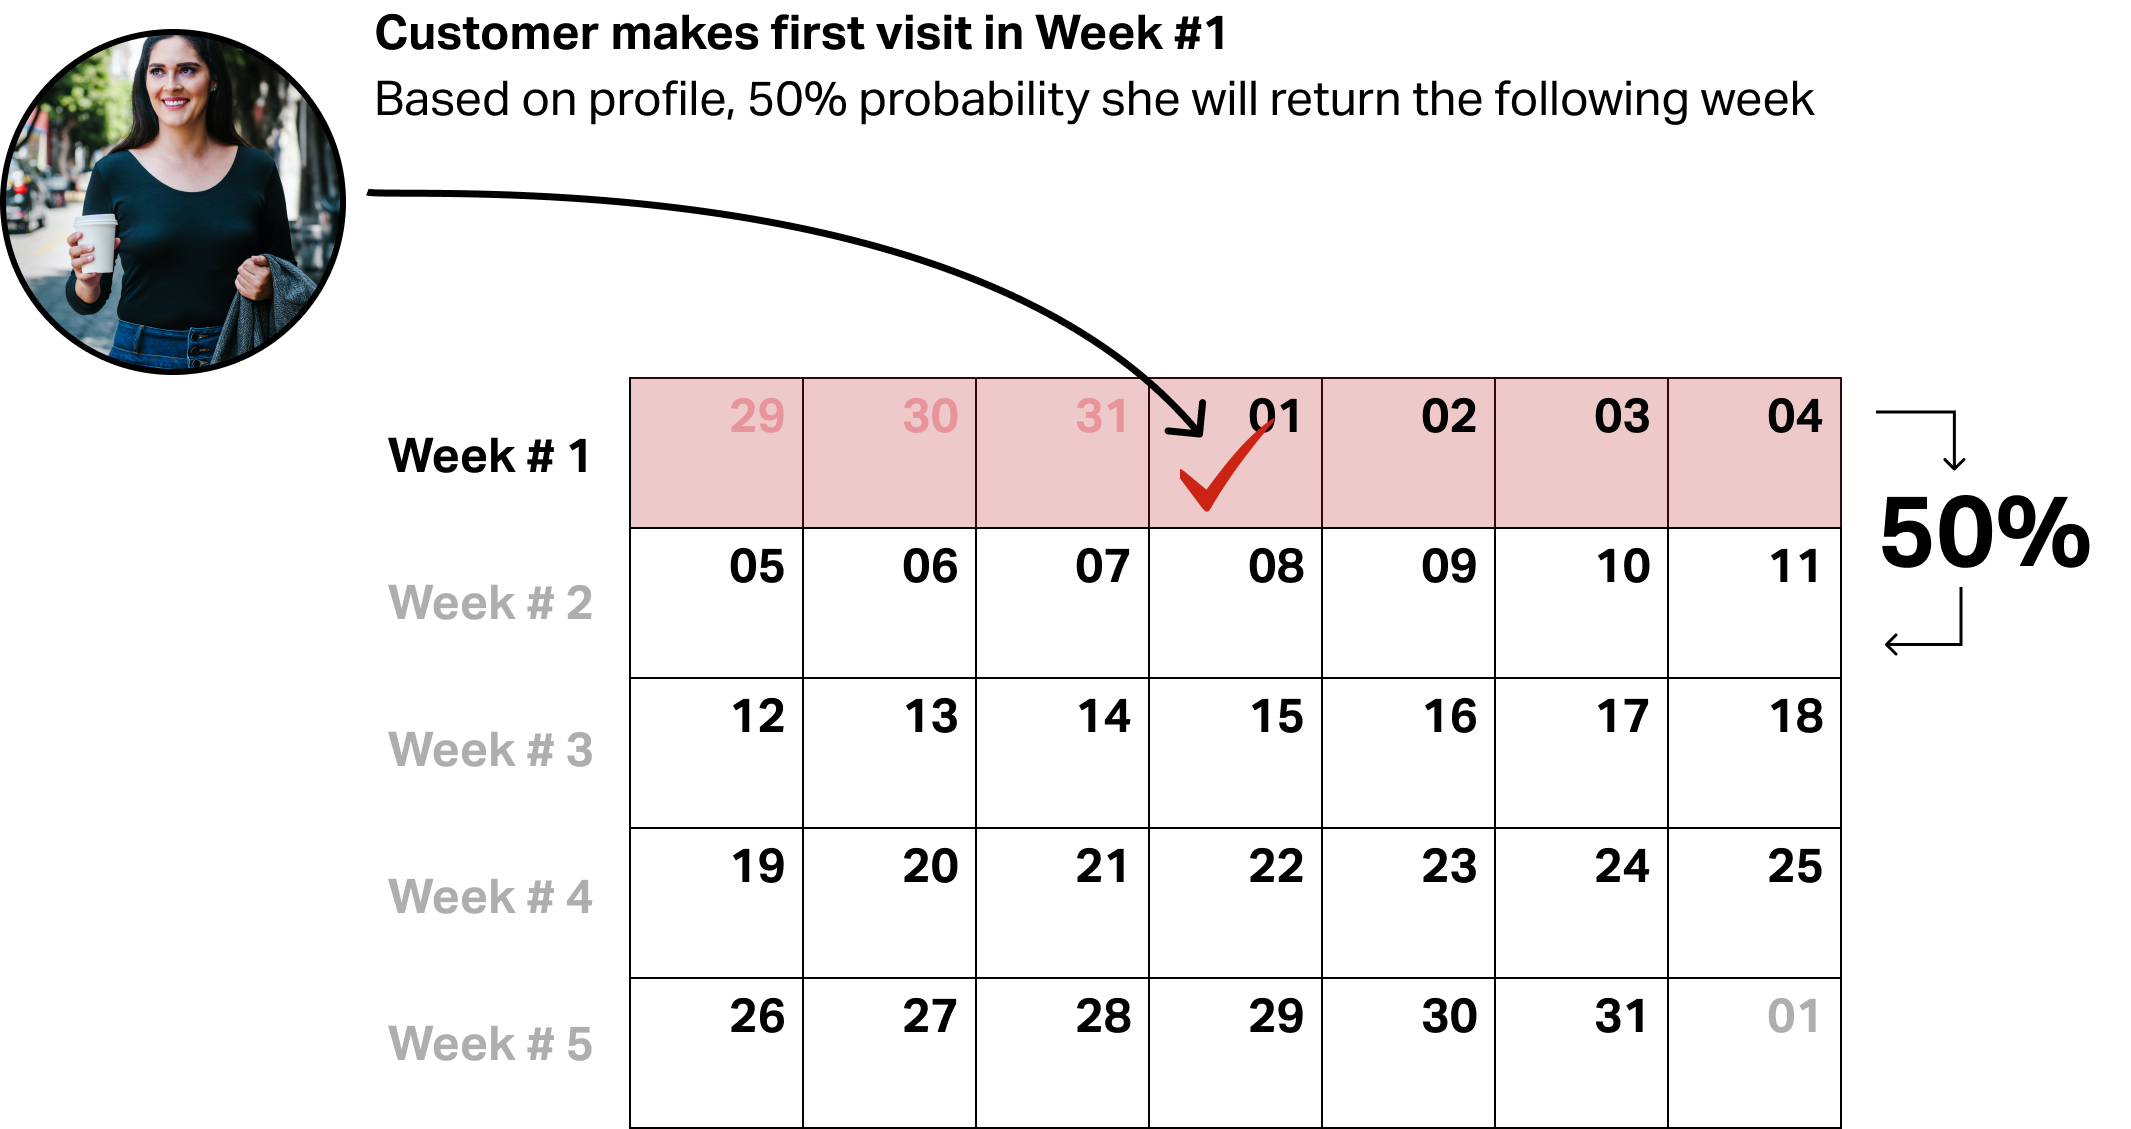
Retention basics

Simple Retention
- Finite life. Assumption: When customers leave, they don’t return.
- Common in B2B and subscription-
based businesses

Migration
- Customers migrate in and out
- Common in retail, CPG, and any
business where customers can
seek variety
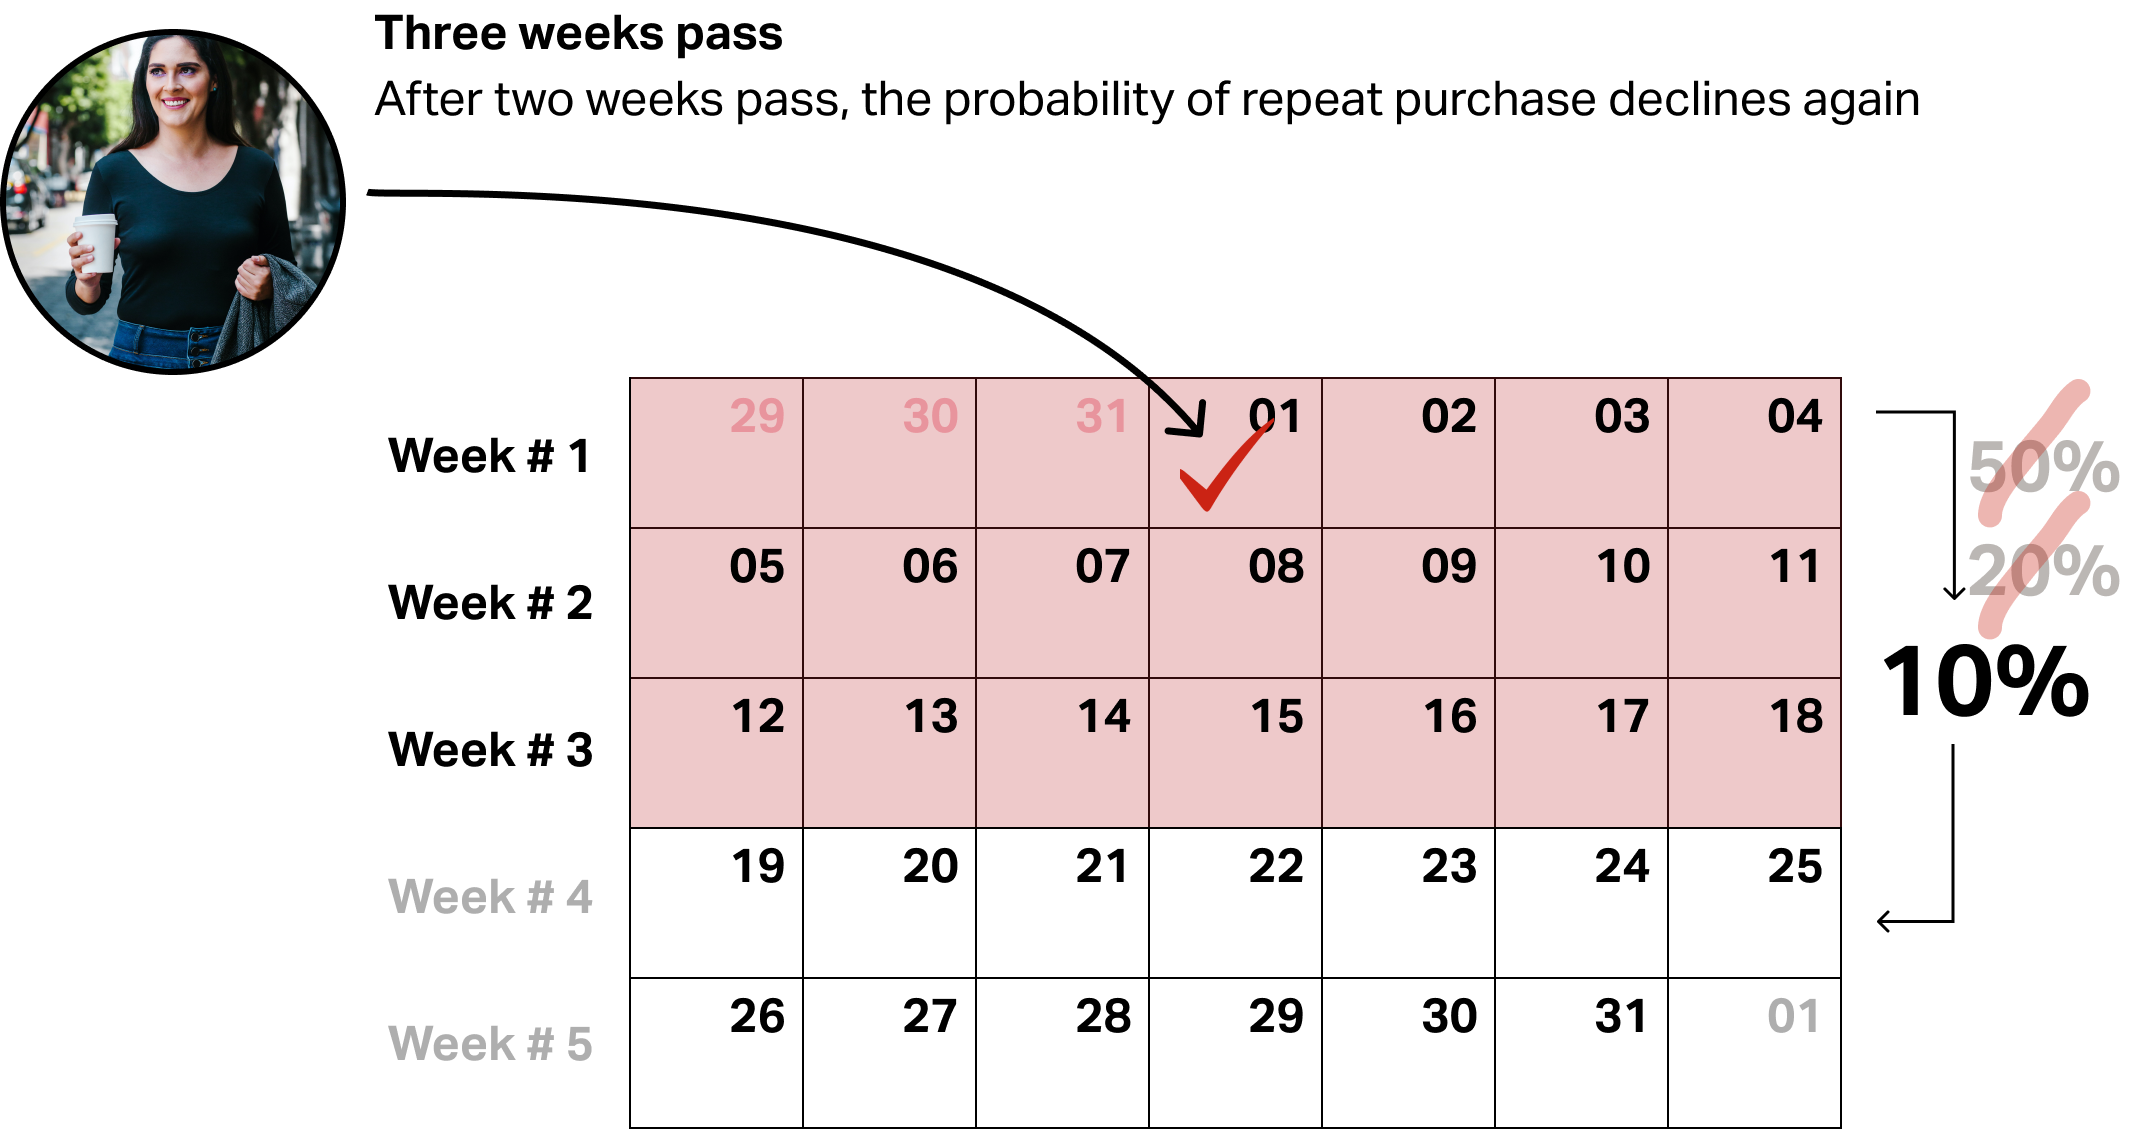
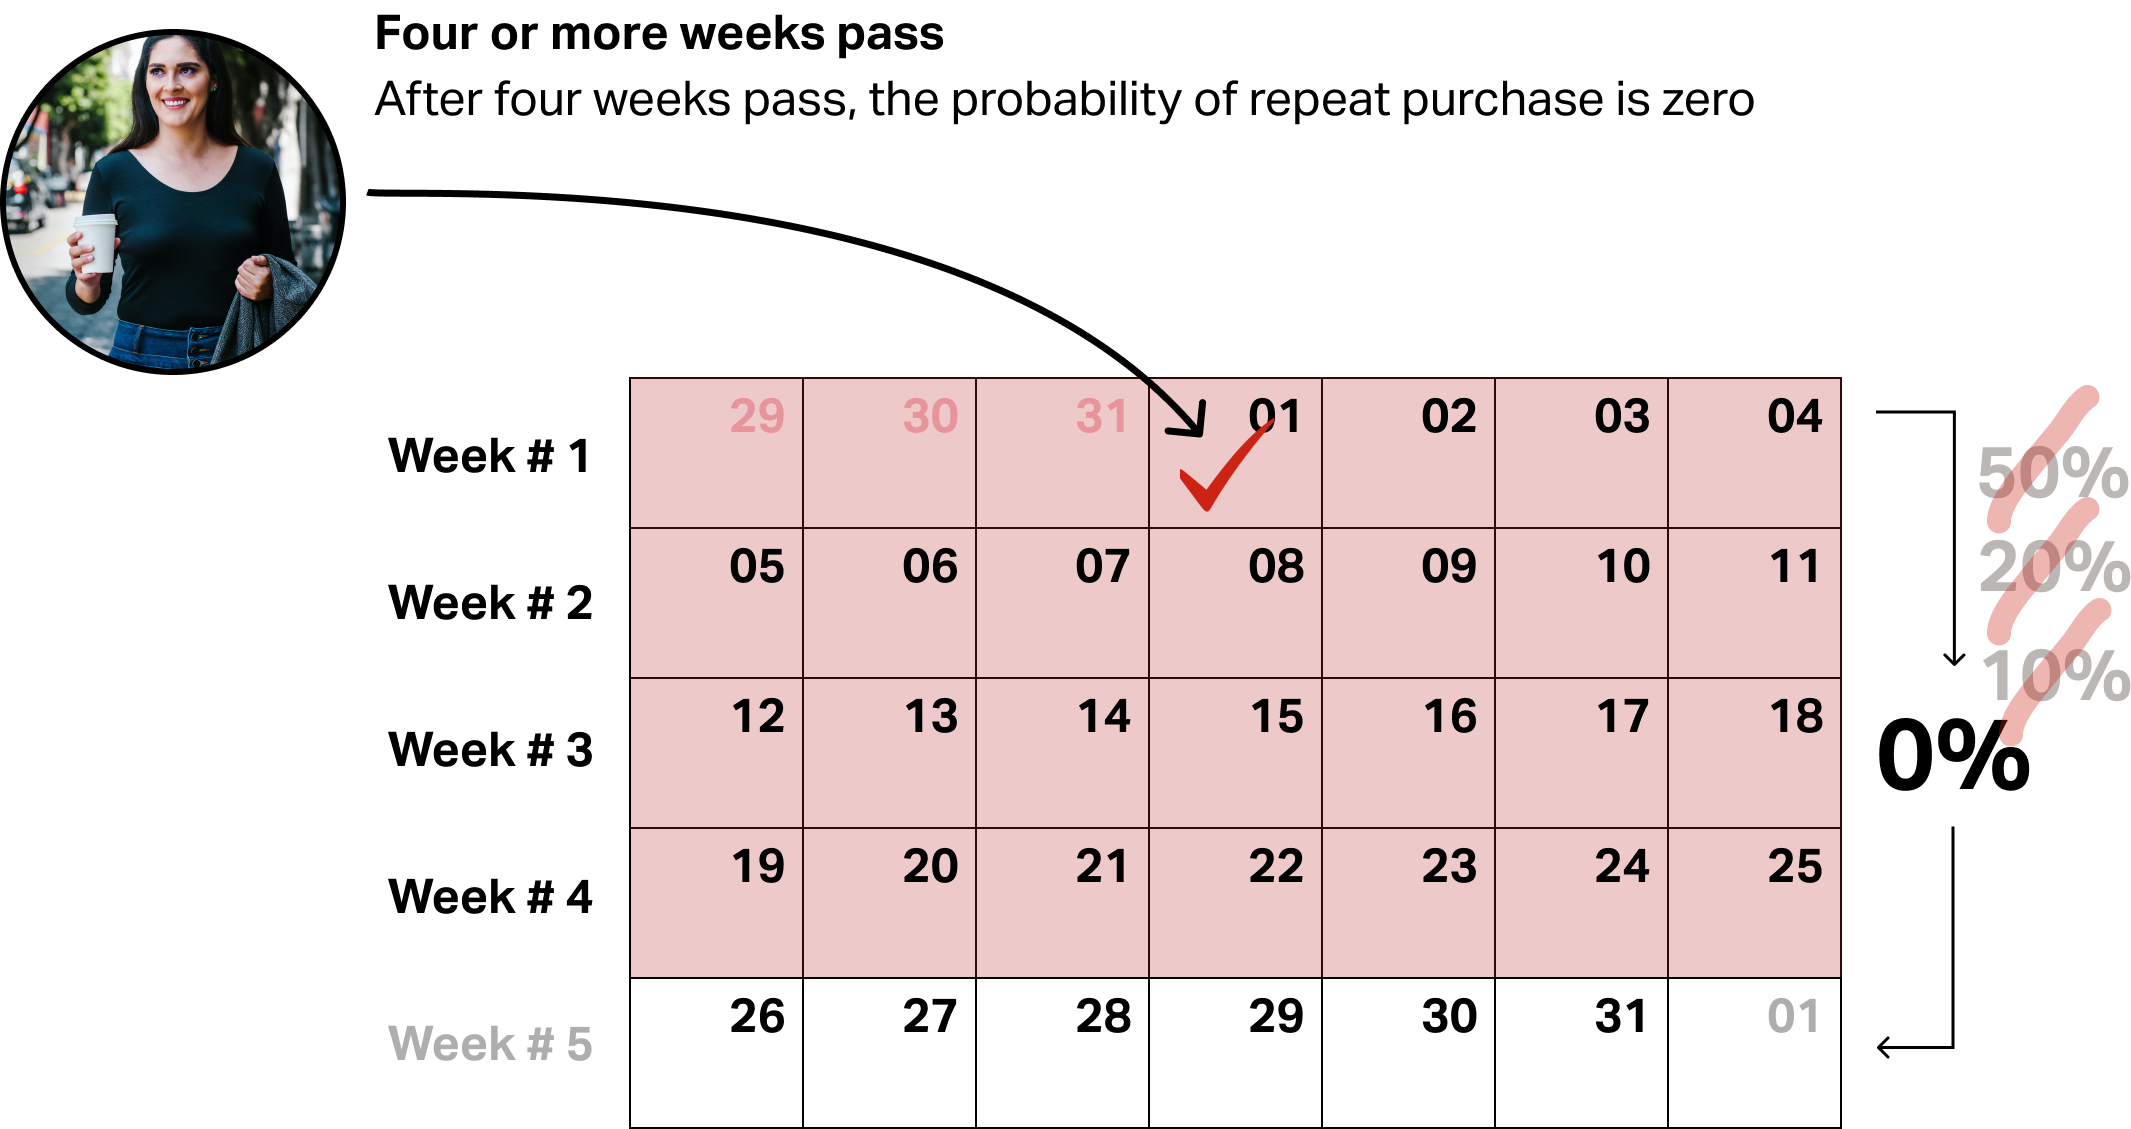
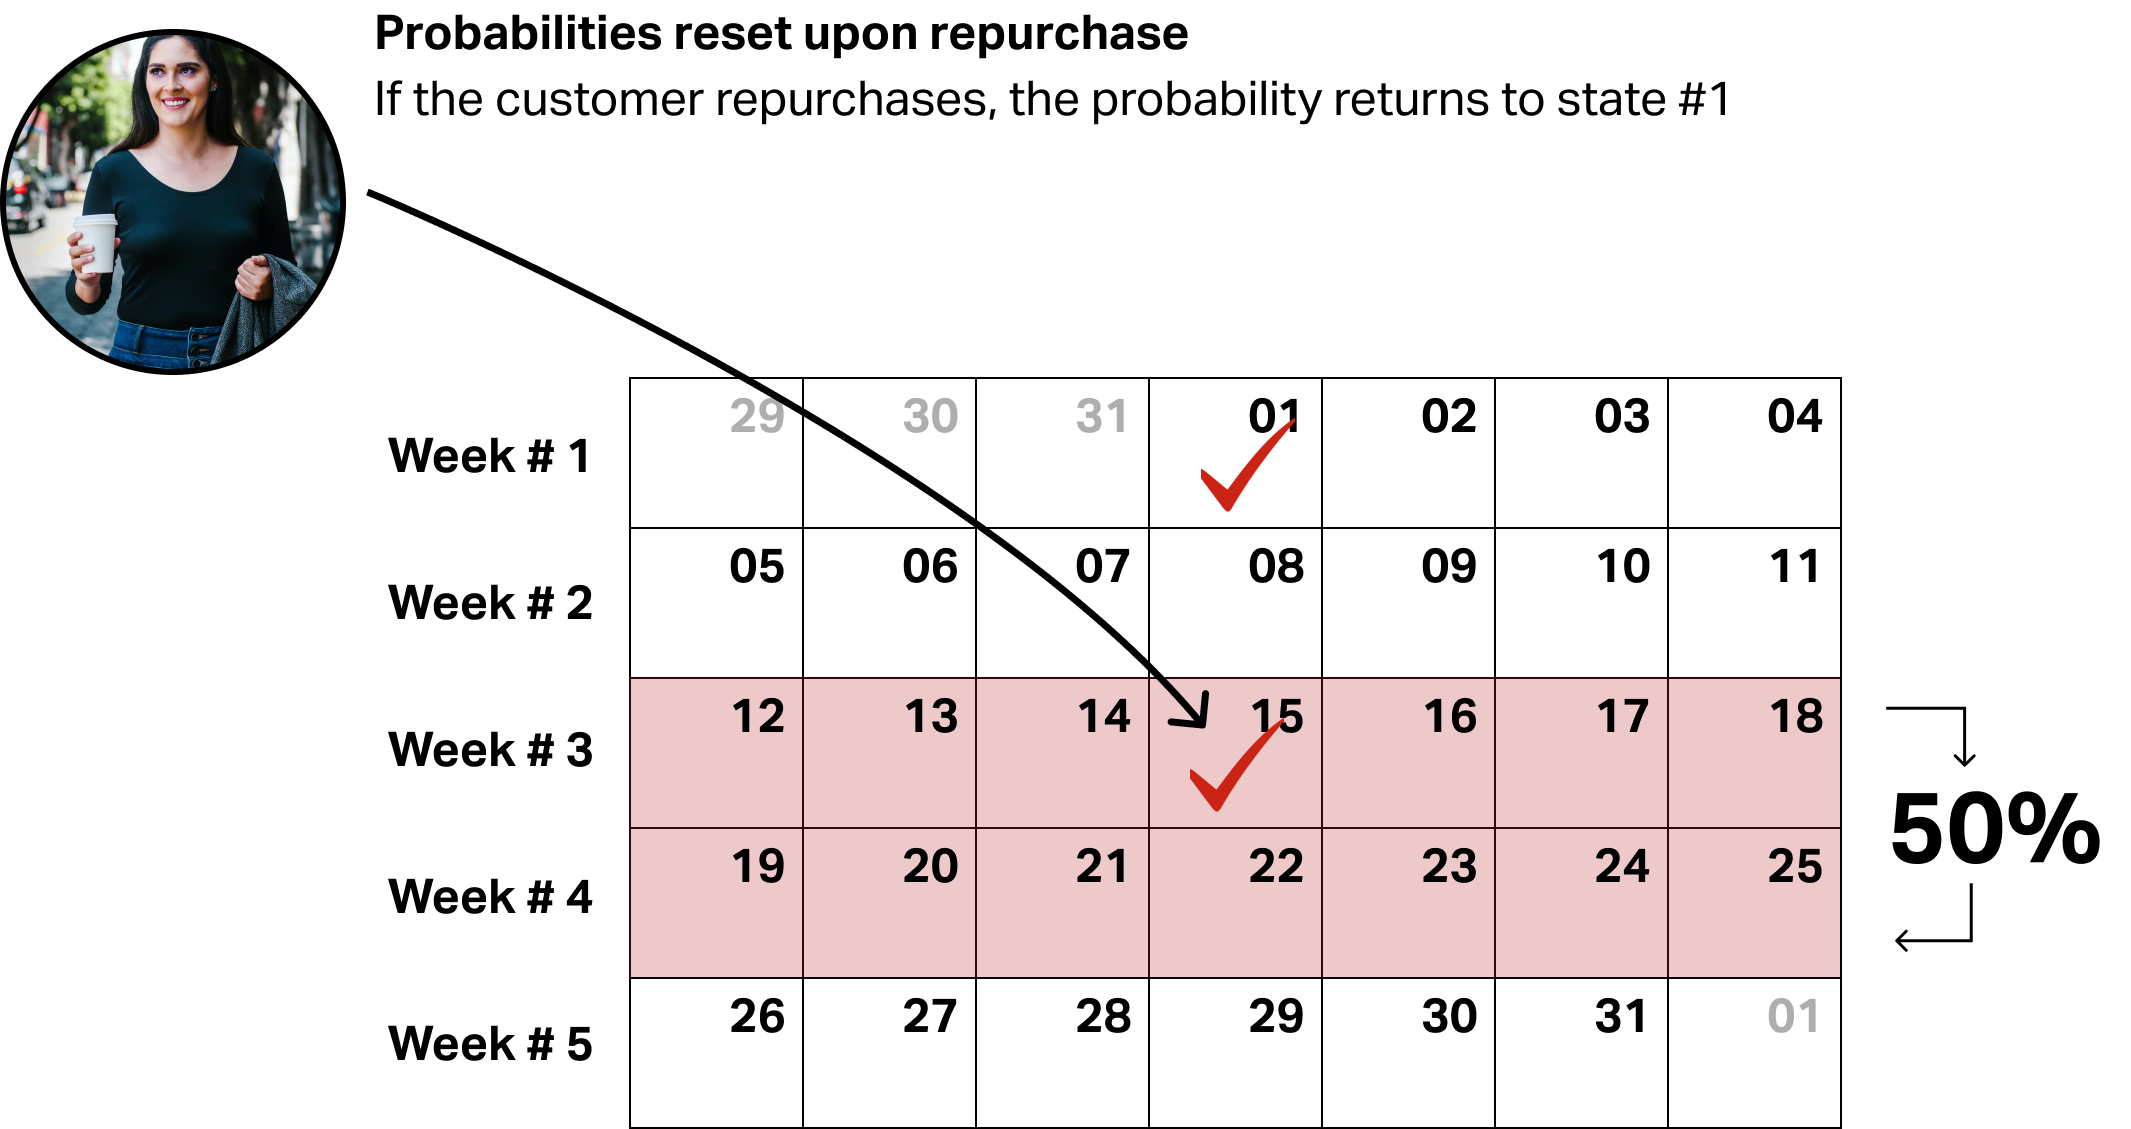
Markov Chain math

Migration model
Migration model
Migration model
Migration model
Migration model
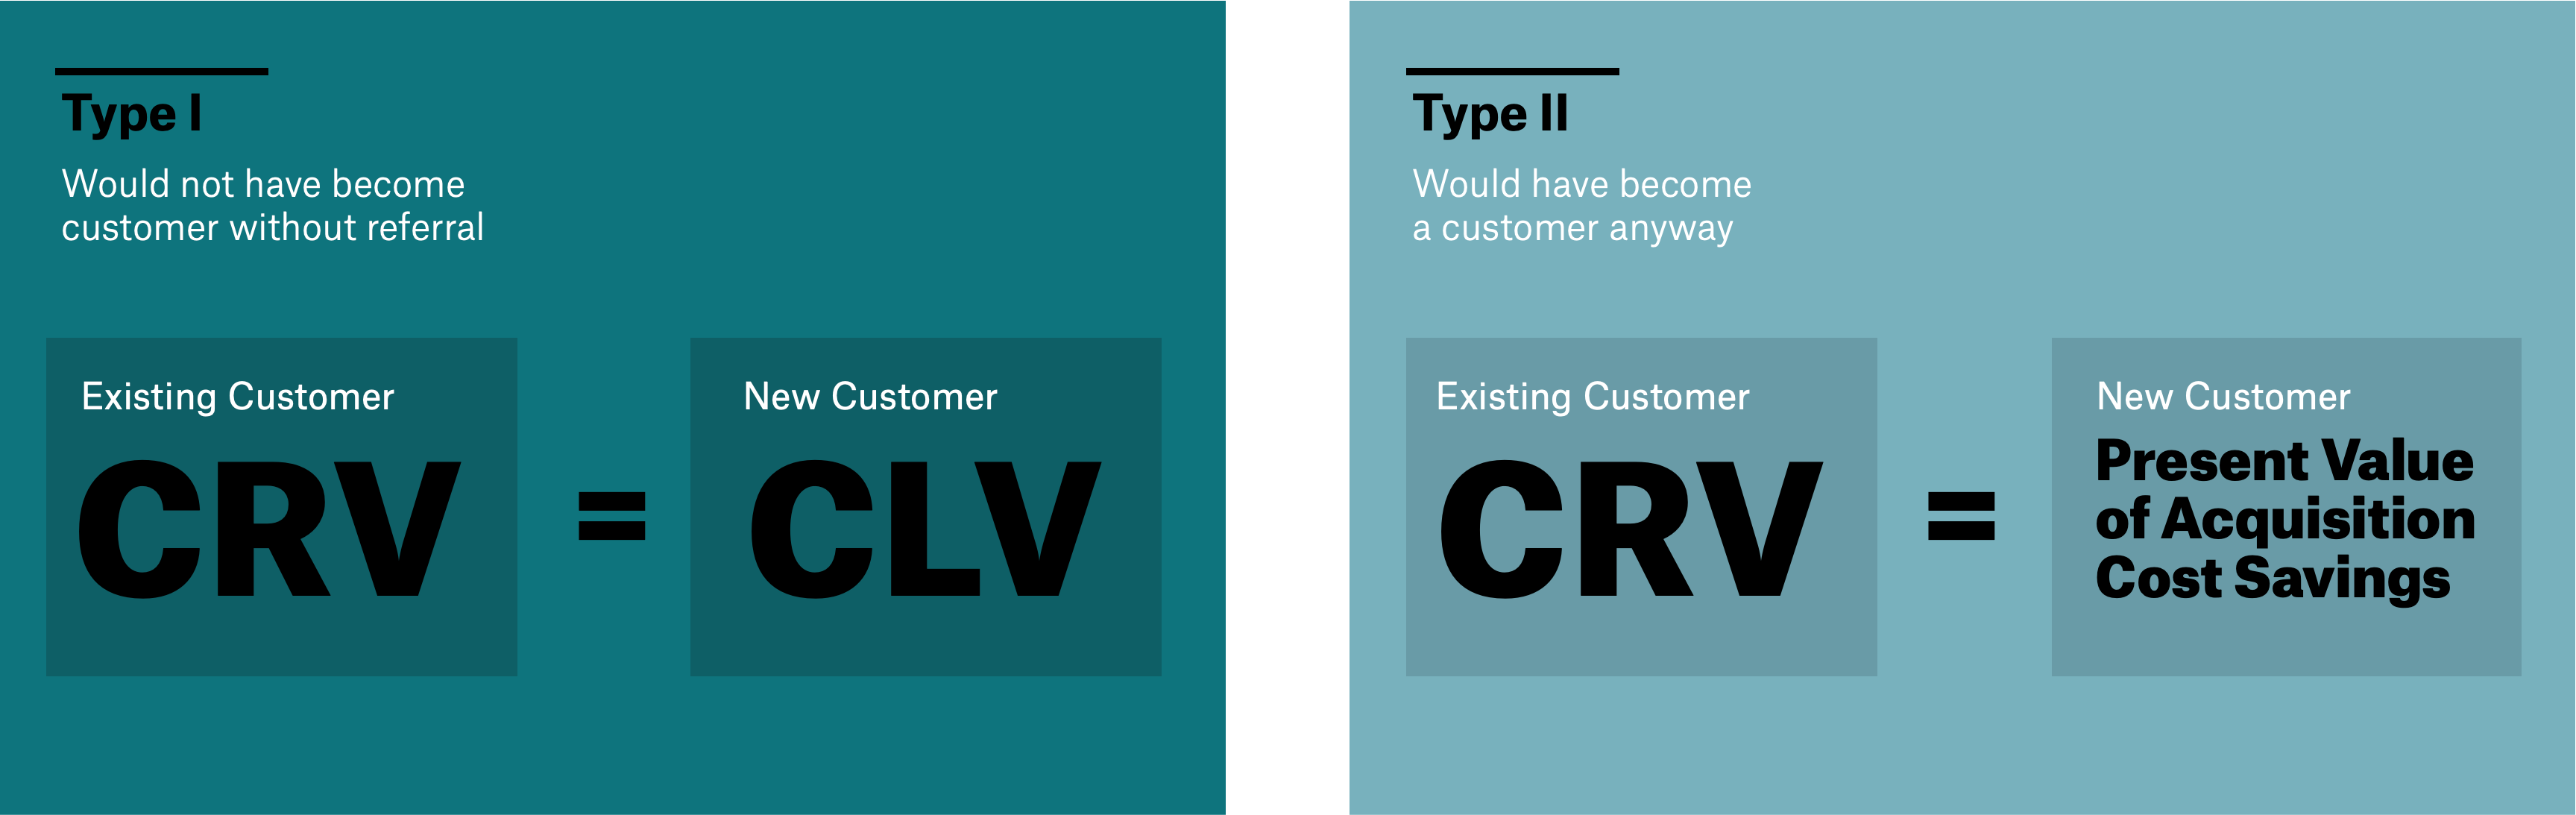
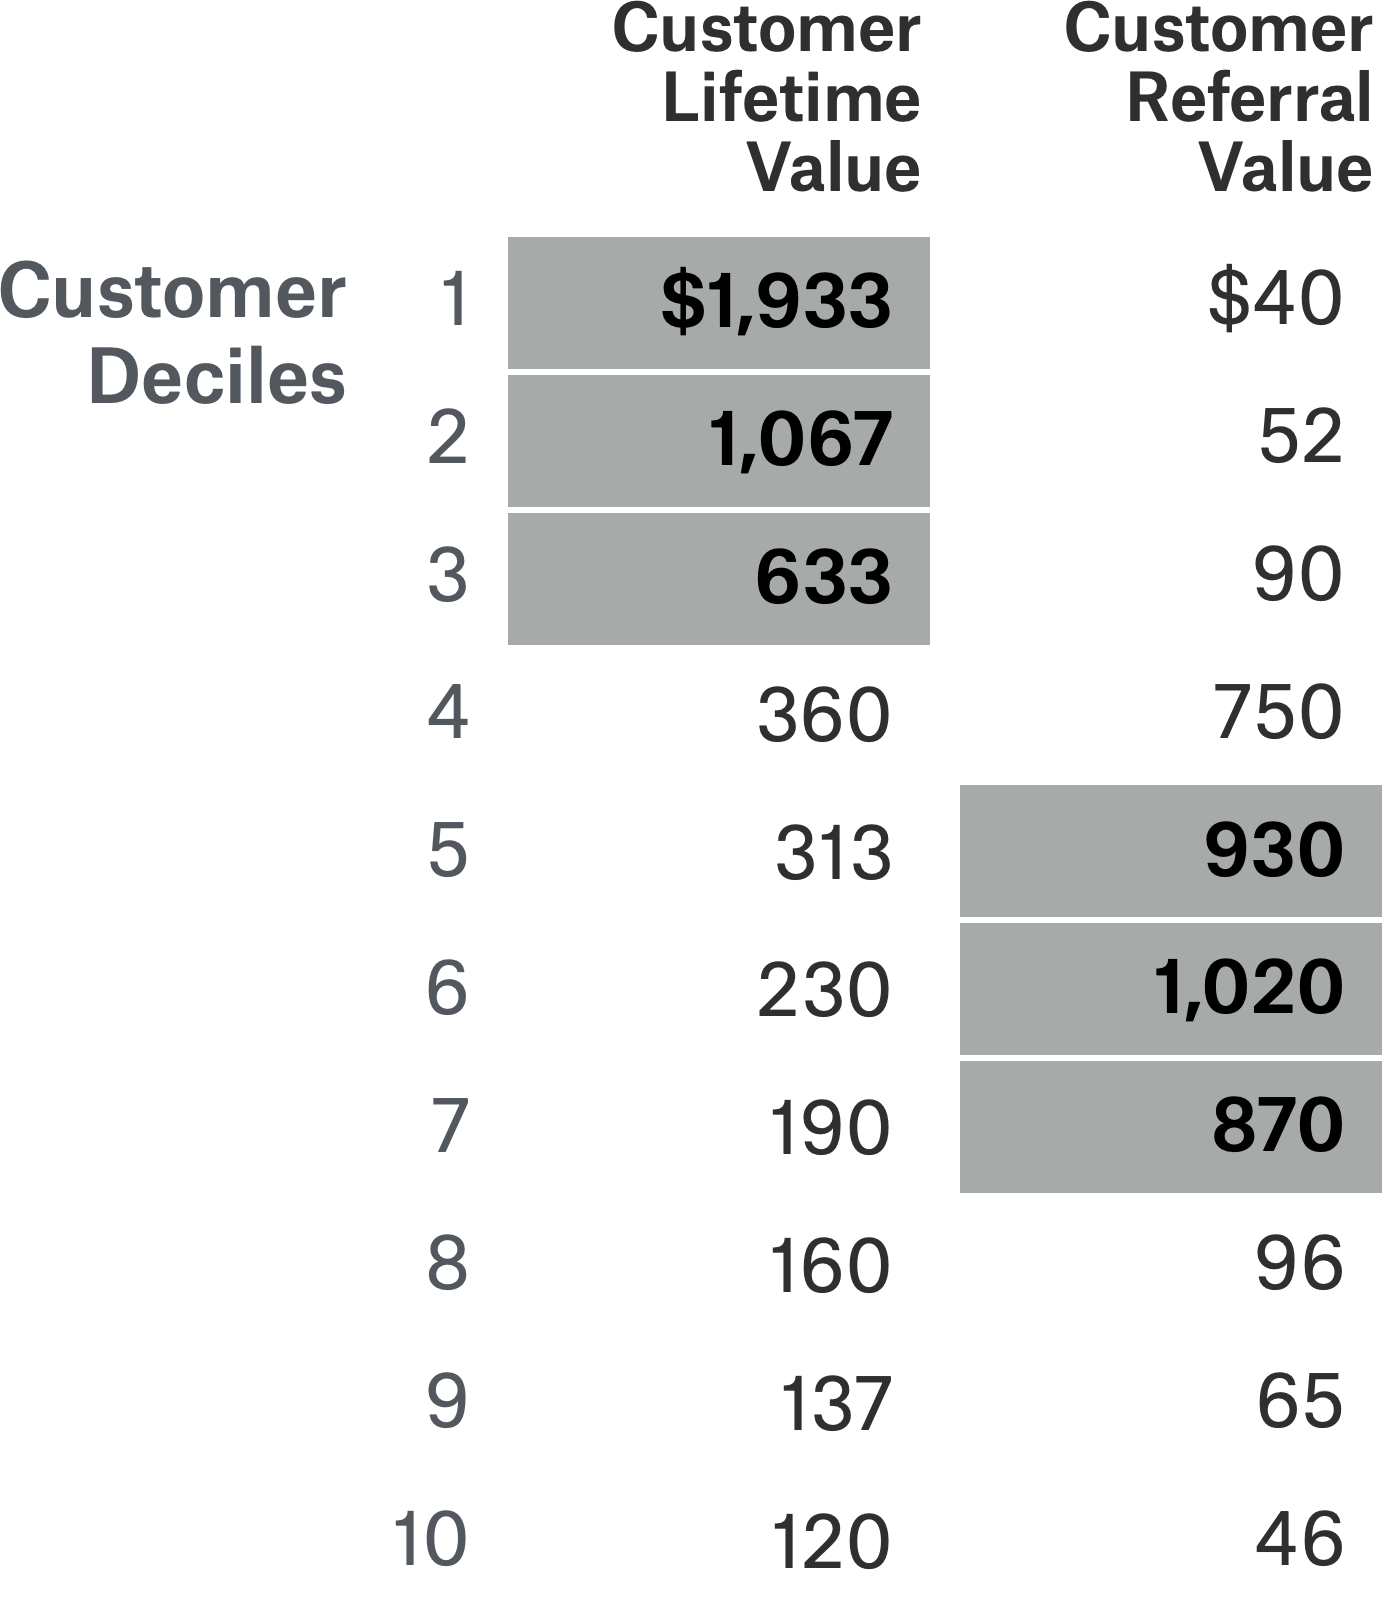
Doing-saying gap
It is possible and common for some customers
to generate more referral value than they do actual CLV.
Prediction vs. reality
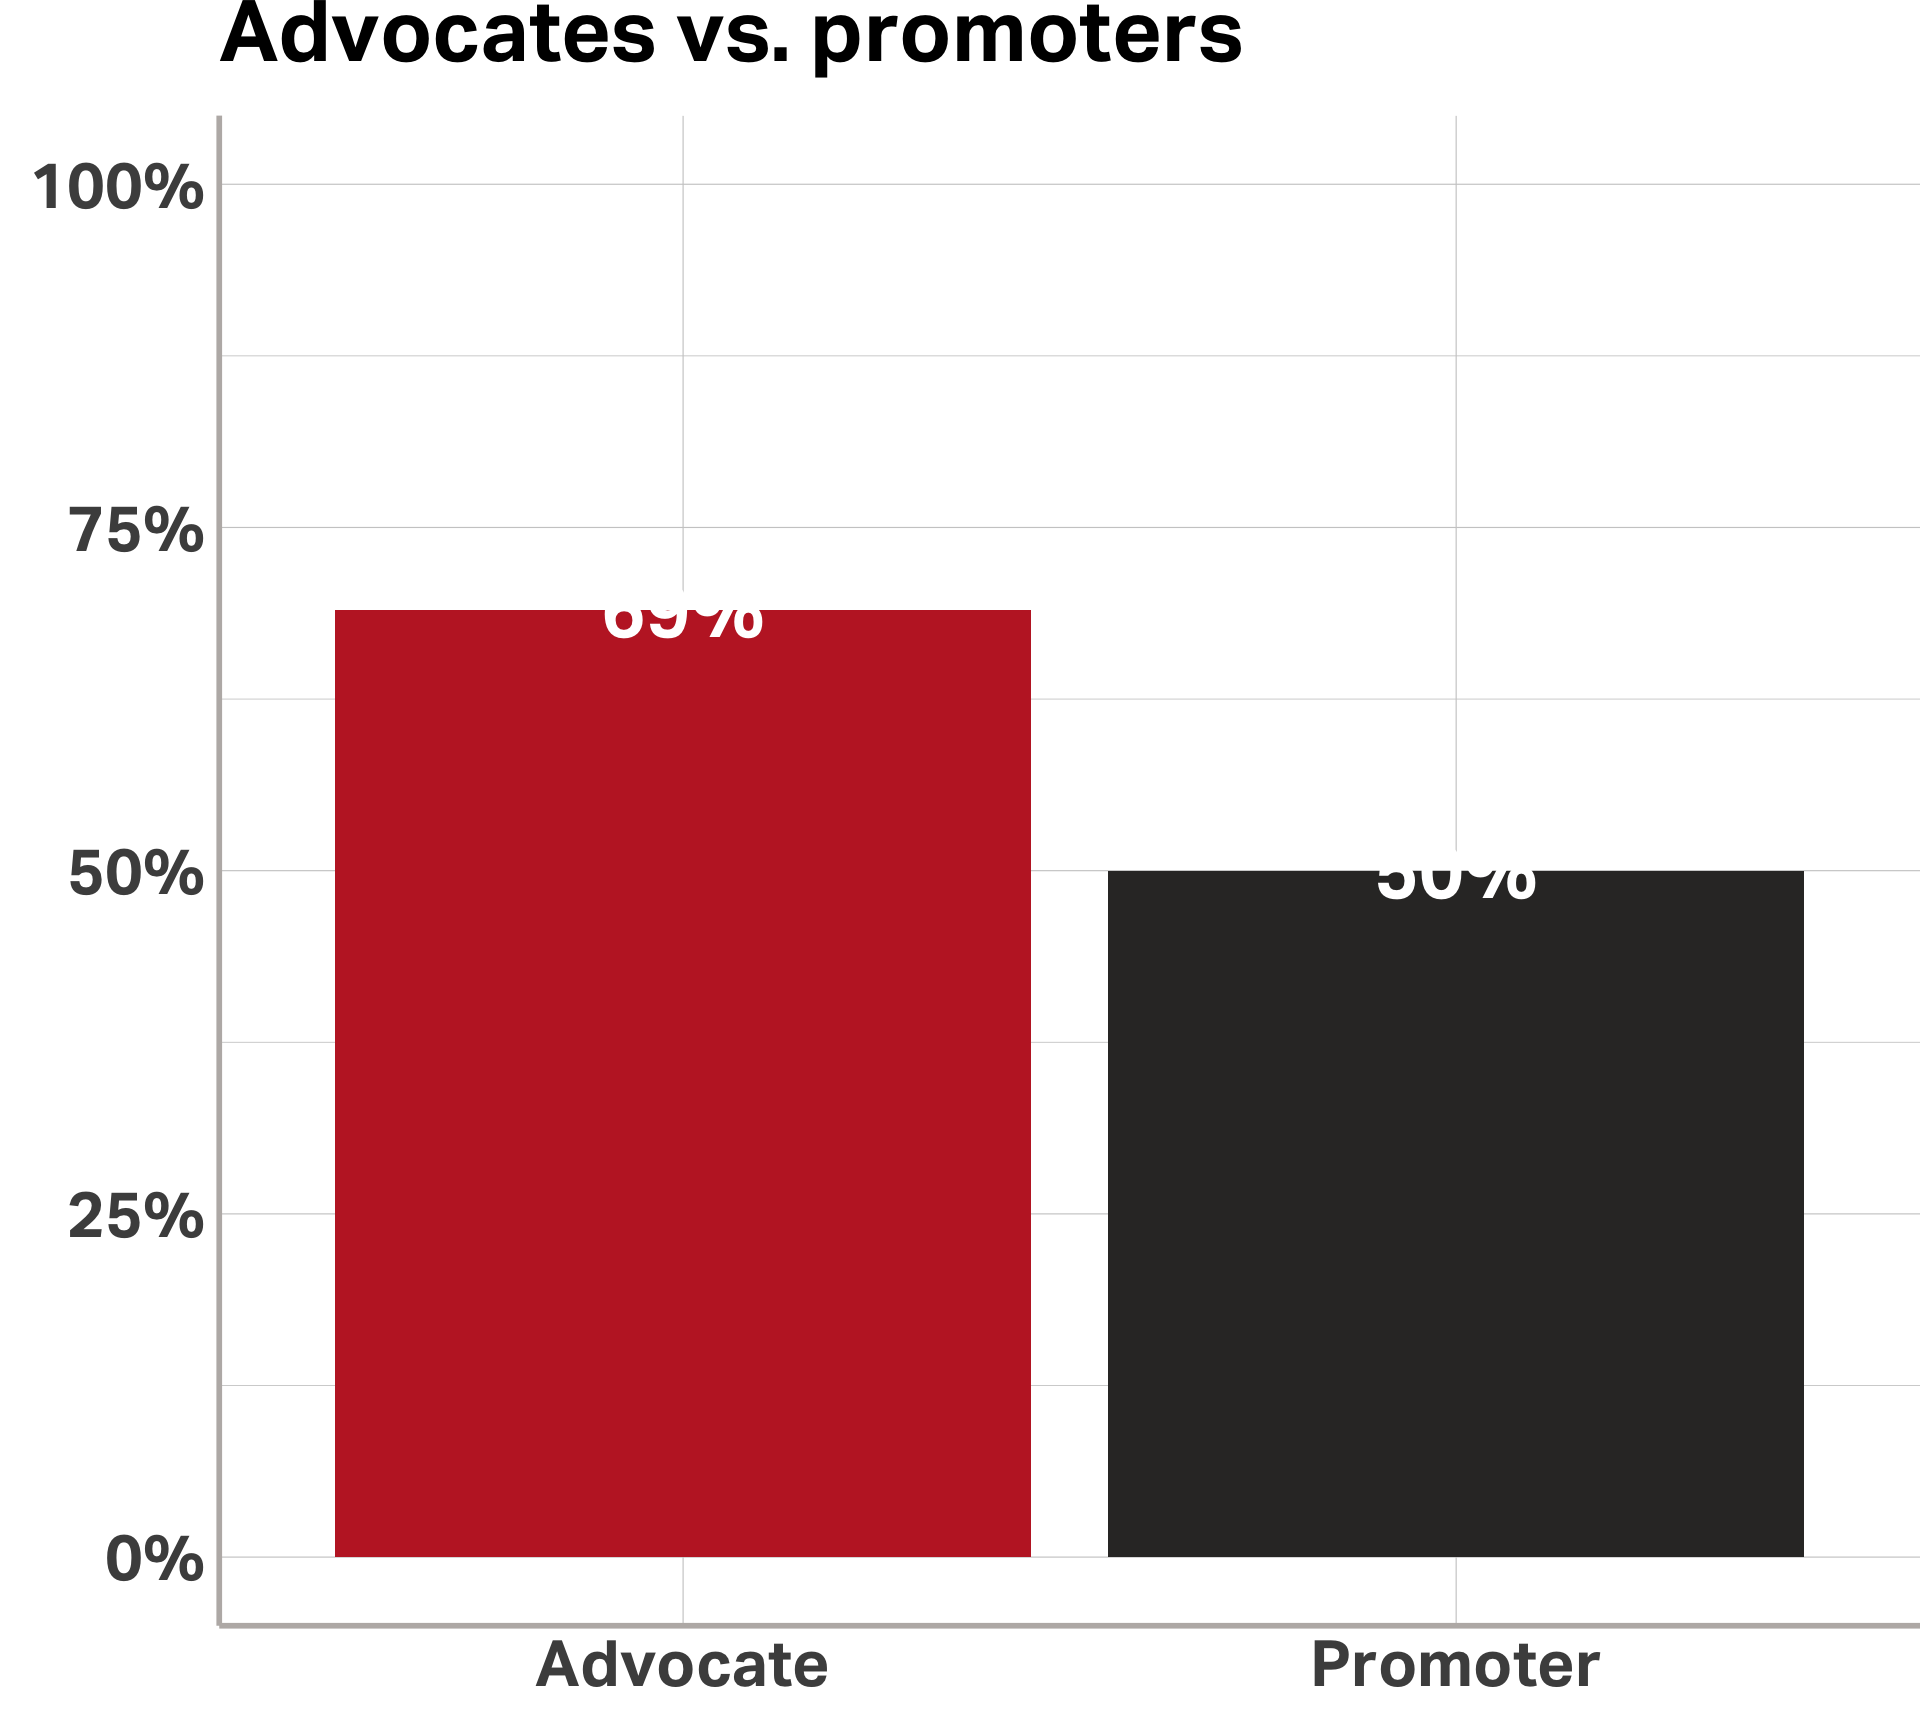
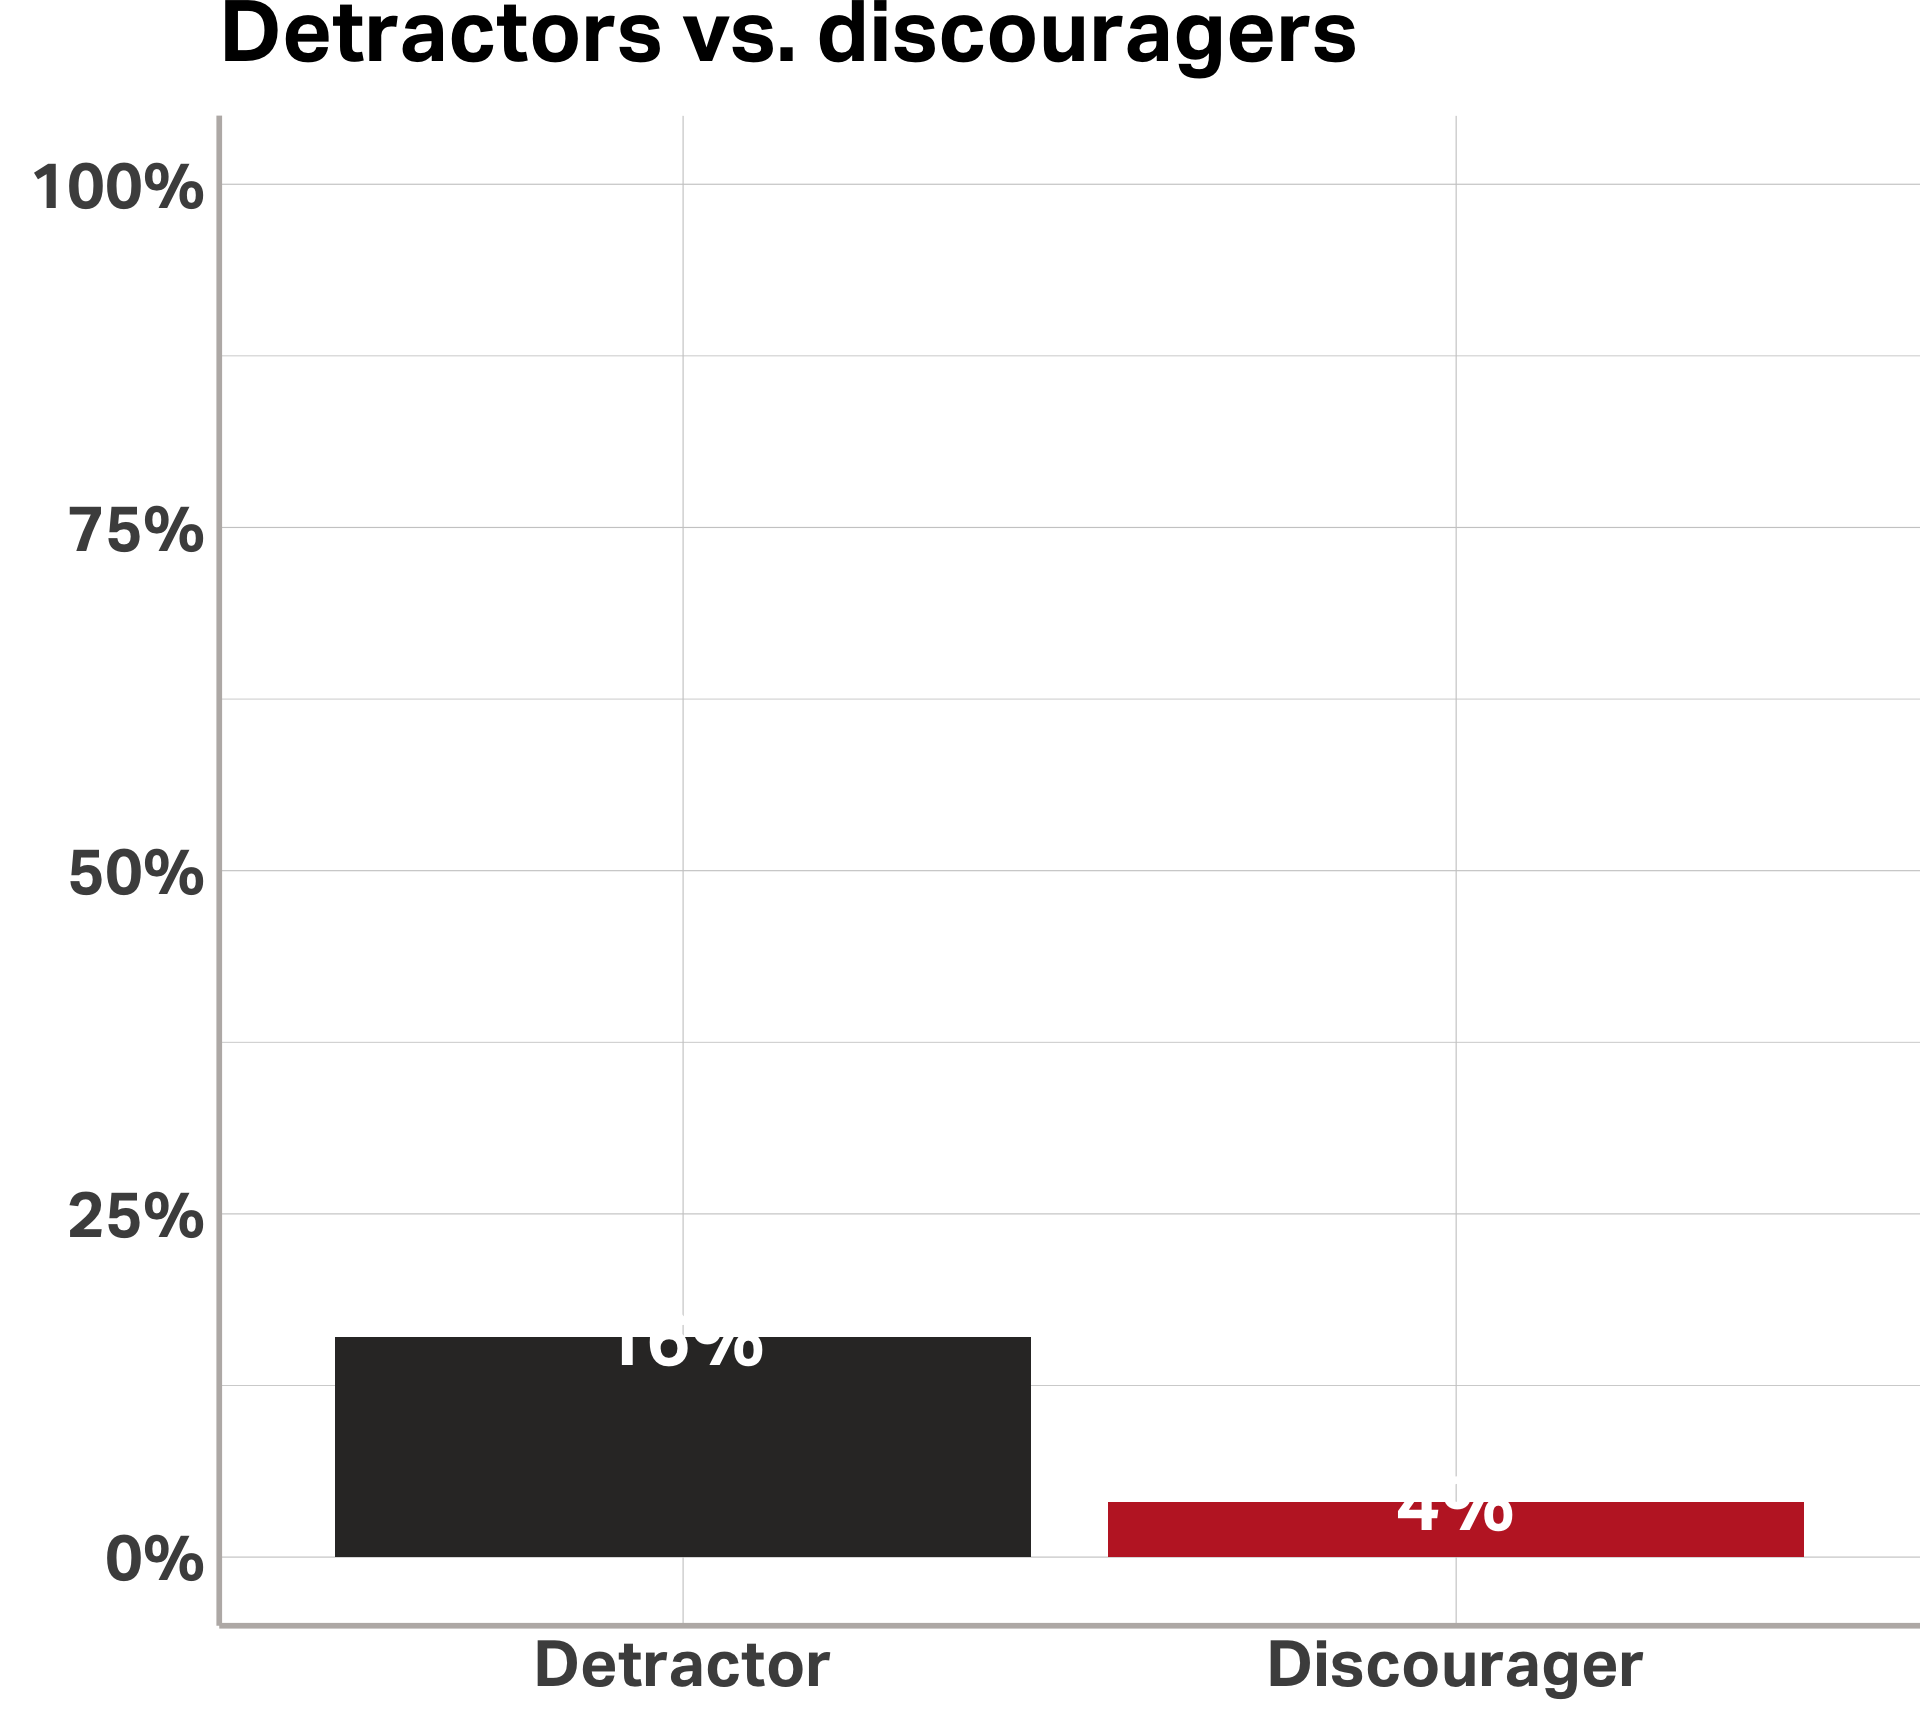
Source: “Where Net Promoter Score Goes Wrong” in Harvard Business Review, 2019
Types of Research

